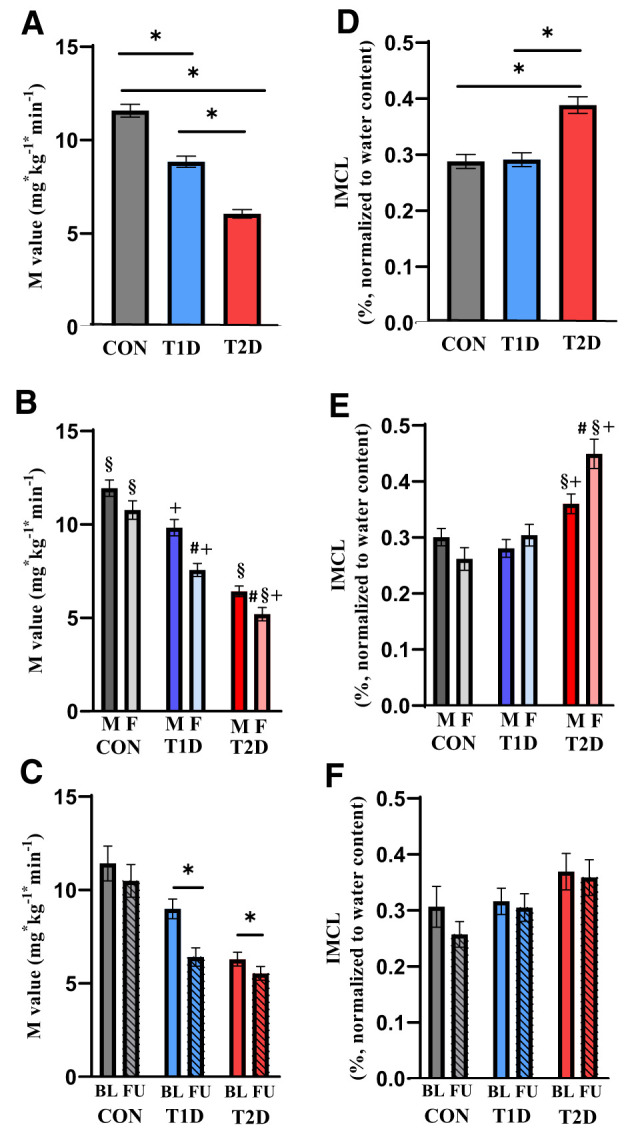
Figure 1.

Whole-body insulin sensitivity from M-value (A–C) and IMCL triglyceride content (D–F) from 1H MRS at baseline and at the 5-year follow-up. A, B, D, and E represent the whole cohort at baseline (glucose-tolerant control [CON] subjects, n = 128; type 1 diabetes [T1D], n = 132; type 2 diabetes [T2D], n = 139), and C and F represent the follow-up cohort (glucose-tolerant control subjects, n = 20; type 1 diabetes, n = 27; type 2 diabetes, n = 38). Sex-specific differences within groups at baseline are shown in B and E (males [M] in darker color, females [F] in bright color). In C and F, hatched columns represent 5-year follow-up (FU) data. Data are presented as mean and SD. P values based on ANOVA by paired or unpaired t tests. BL, baseline; *P < 0.05. #P < 0.05 vs. men within the same group. §P < 0.05 vs. same sex of the T1D group. +P < 0.05 vs. same sex of the control subjects group.
