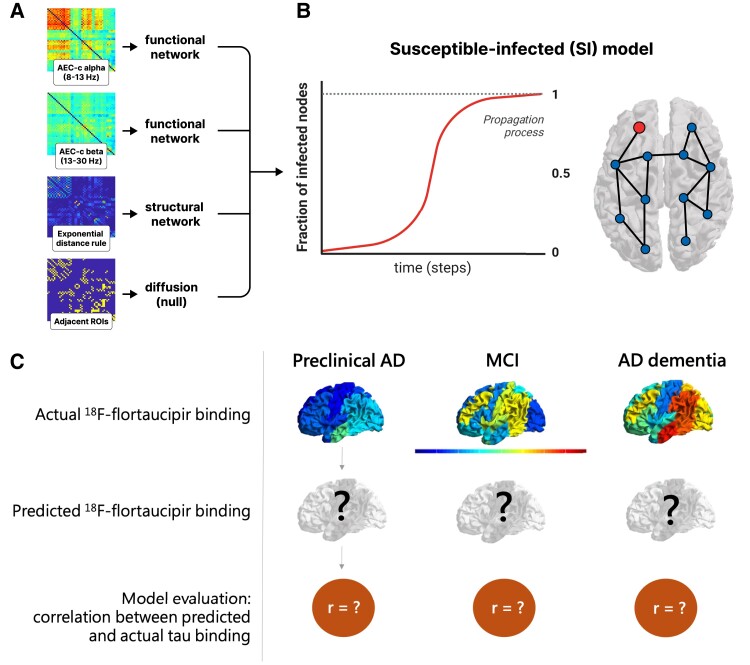
Figure 1.
Workflow visualizing the prediction model. (A) The group level connectivity between 50 regions of interest (ROIs) of the adjusted Hammers atlas serves as the basis for the functional (AEC-c in alpha and beta band), structural (EDR) and diffusion (adjacent ROIs) networks. (B) The networks are used as the backbone for the epidemic spreading model (SI model), where the fraction of newly infected nodes (red line), is represented as a function of time. (C) For each network and each disease stage, the spreading dynamics were simulated and the propagation pattern was constructed across all 50 ROIs, and compared with the actual 18F-flortaucipir pattern. AD = Alzheimer’s disease; AEC-c = corrected amplitude envelope correlation; MCI = mild cognitive impairment.

