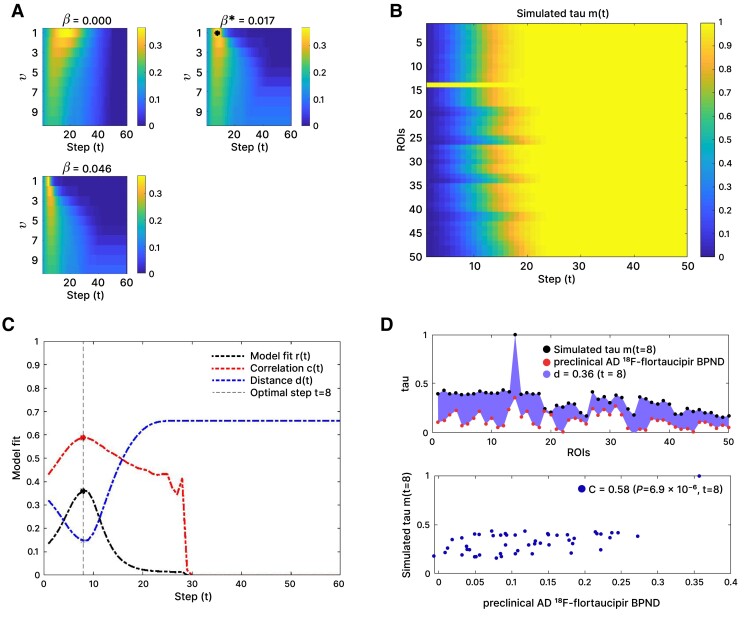
Figure 3.
Exemplary susceptible-infected propagation process for the functional network (AEC-c, alpha band) predicting tau spread in the preclinical Alzheimer’s disease stage using the control network. (A) Correlation between actual and predicted tau deposition for different spreading rates (β) and different weightings (v) of the functional connections. The optimum fit is indicated with an asterisk. (B) Model propagation pattern showing the probability pi(t), that a given region of interest (ROI) i (y-axis) is infected at simulation step t (x-axis). The seed (‘left middle and inferior temporal gyri’, ROI 14) is by definition infected at simulation Step 0. (C) Goodness of model fit, considering the total tau load [distance d(t)], the spatial pattern of the tau load [correlation C(t)], and final model fit [r(t)] for each simulation step (t). The dashed vertical line indicates the simulation step with the optimum model fit, in this case t = 8. (D) Simulated tau spread and observed tau spread by ROI (top), and the predicted tau spread versus observed tau spread for the optimal time point (t = 8), with the corresponding correlation and P-value (bottom).

