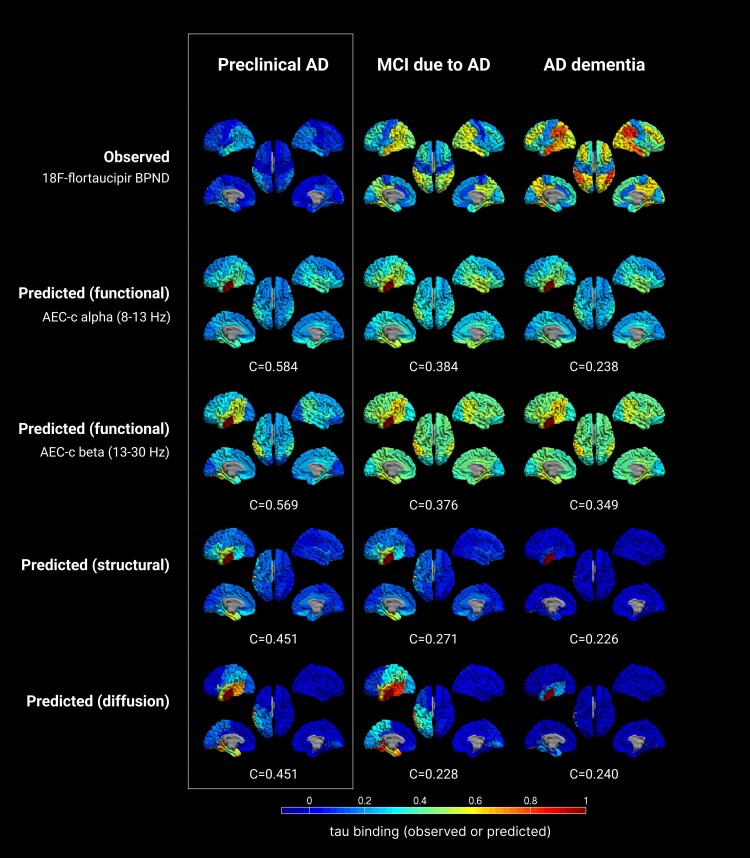
Figure 4.
Observed versus predicted patterns of tau spreading in several stages of the Alzheimer’s disease continuum. The top row displays the observed clinical 18F-flortaucipir-PET BPND for each group. The other rows display the predicted spreading patterns for the different (functional, structural, diffusion) networks, based on the group level control network and a single seed region, with the corresponding optimum correlation coefficient evaluating model performance. Warmer colours represent a higher proportion of regional tau-binding, or higher probability of infection. Note that in the predicted data, the seed region (ROI 14) is always infected with maximum tau binding (by definition). AD = Alzheimer’s disease; AEC-c = corrected amplitude envelope correlation; MCI = mild cognitive impairment.

