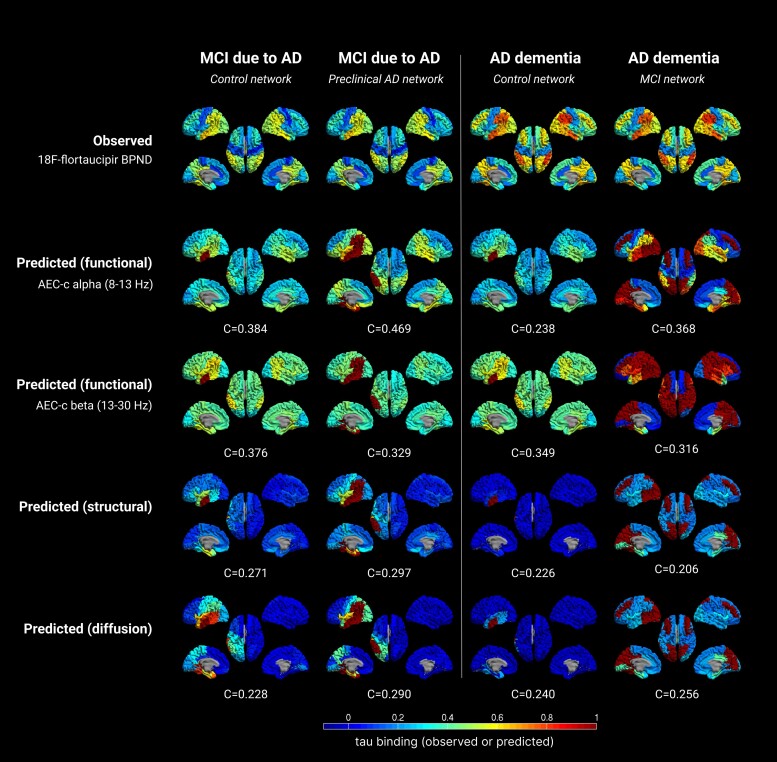
Figure 6.
Observed versus predicted patterns of tau spreading in several stages of the Alzheimer’s disease continuum, for the third model. The first and third columns show the original results from the first model, using the control network as backbone, with the second and fourth columns showing the new results, based on the networks of the preceding disease stage and alternative seed regions (based on tau cut-offs), with the corresponding correlation evaluating model performance. The rows again display the observed clinical 18F-flortaucipir-PET BPND, and the predicted spreading patterns for the different (functional, structural, diffusion) networks. Warmer colours represent higher proportion of regional tau-binding. Note that in the predicted data, the seed regions are always infected with maximum tau binding. AD = Alzheimer’s disease; AEC-c = corrected amplitude envelope correlation; MCI = mild cognitive impairment.

