Fig. 15.
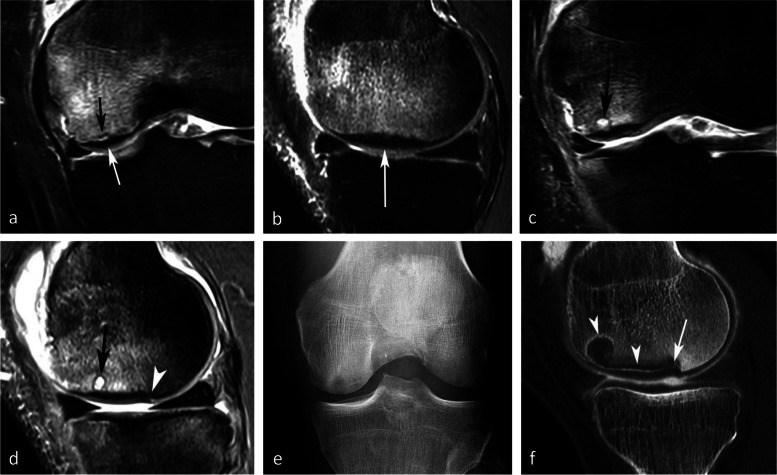
Example of a pejorative evolution of a SIF to a SIF-ON. a, b At the initial stage, the BME-like high intensity on fat-suppressed T2-weighted MR image and a small fissure line (black arrow in a) are suggestive of a SIF. However, the subchondral bone adjacent to the cartilage shows a thick and extensive low signal-intensity area (white arrows in a and b). c, d Five months later (c, d) the marrow abnormalities persist, with the appearance of small geode-like images (arrows) and a small break in the subchondral bone plate (arrowhead in d). e, f Three months later, radiograph (e) still shows heterogeneous density of the lower condylar pole, and CT arthrography (f) shows a subchondral geode and bone resorption (arrowheads), associated with a focal collapse of the subchondral bone surface (arrow)

