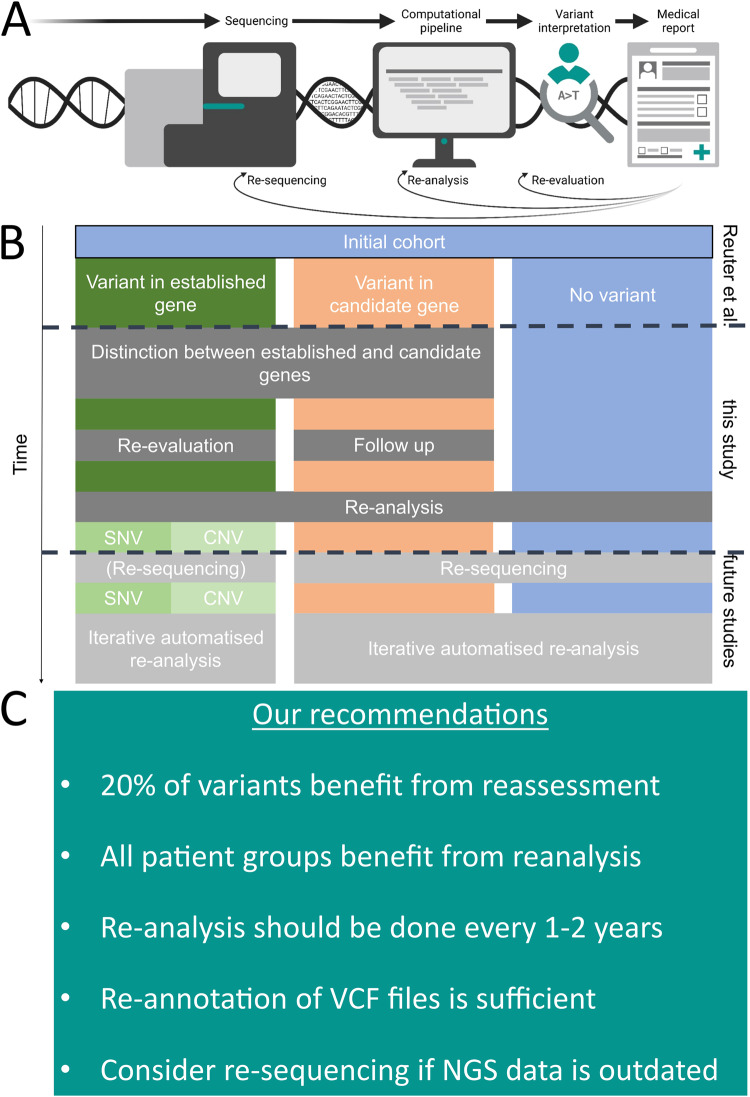
Fig. 1. Infobox, re-evaluation and re-analysis flow diagram and recommendations.
Panel A shows an infobox summarizing the basic terms in this study (panel created with BioRender.com). B A schematic flow diagram of the previous analyses performed by Reuter et al. on the same cohort, which we re-analysed with three of the main possible outcome columns from exome screening, performed the described analyses, and finally evaluated recommendations for future pipelines incorporating automated iterative re-analysis and re-sequencing. C Infobox with our recommendations for re-evaluating and re-analysing NDD screening studies.

