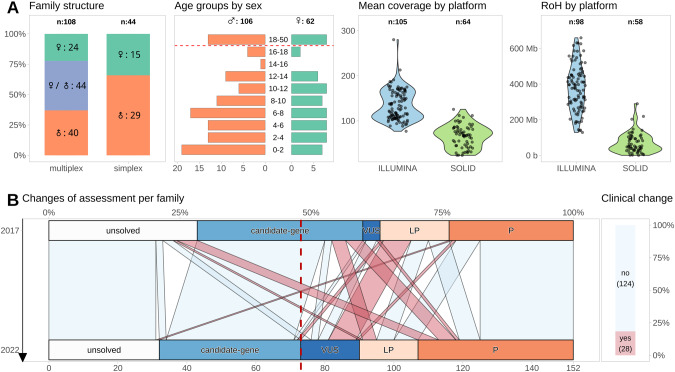
Fig. 2. Cohort and data characteristics with results of re-evaluation.
A Distribution of the 152 assessed families classified as simplex with one affected individual and multiplex with at least two affected individuals with sex distribution of the affected individuals in these groups (first panel). The age distribution by sex in the whole cohort (note, that not all individuals could be included in this plot since one index had no age and another had no sex data). The y-axis depicts age classes at 2-year intervals for pediatric cases, plus one class for adult index individuals. The x-axis shows the number of individuals, with females on the right (green) and males on the left (red) side (second panel). The mean coverage (third panel) and length of RoHs (fourth panel) were generally higher in samples analyzed by an Illumina platform than in samples sequenced with SOLiD technology, indicating quality differences. B The alluvial plot on the left side depicts the changes in clinical assessment conclusion of the families between 2017 and 2022 (Please note that this is distinct from variant classification changes. Reuter et al. identified, for instance, a variant in the candidate gene CLMN and a VUS in the TRAPPC9 gene in the MR333 family. We reclassified the VUS as benign and identified a pathogenic variant in ADNP as the cause of the affected individual’s symptoms. The alluvial plot thus displays a line from VUS to P.). This results in clinically relevant changes in 28/152 families (18%, red; bar plot on right side colored according to the alluvial connections on the left side). The dashed line displays the shift in families where a VUS or (likely) pathogenic variant was identified. LP likely pathogenic, P pathogenic, RoH run of homozygosity, VUS variant of uncertain significance, ♀ female individual, ♂ male individual.

