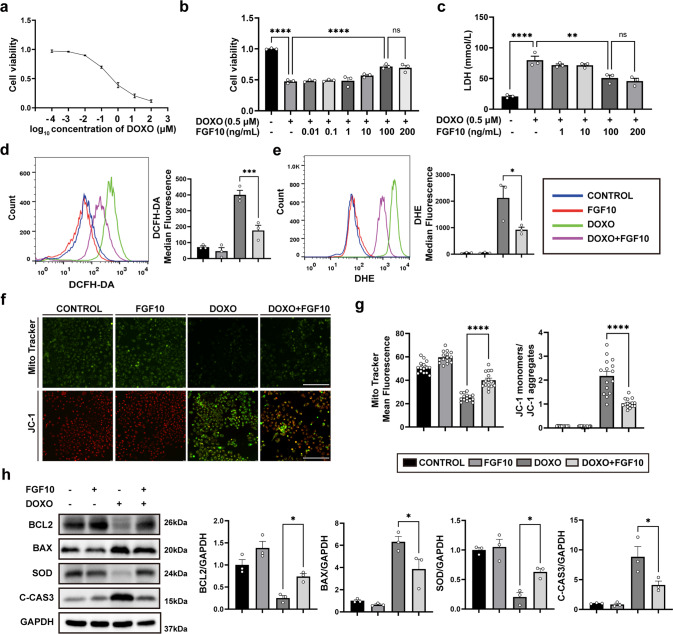
Fig. 4. FGF10 mitigates DOXO-induced cytotoxicity in cultured cardiomyocytes.
a HL-1 cell viability was analyzed using the MTT assay to establish the dose response curve of DOXO at 24 h after DOXO administration. b The effect of different concentrations of FGF10 on DOXO treatment was determined. c Cell injury was measured by the release of LDH. d ROS generation was visualized by DCFH-DA staining and analyzed by flow cytometry. The results are presented as the median fluorescence intensity. e Superoxide production was assessed by DHE with flow cytometry. The results are presented as the median fluorescence intensity. f Representative images of MitoTracker and JC-1 staining in each group (×400 magnification). g Statistical analysis of MitoTracker and JC-1 staining. The results of MitoTracker staining are shown as the mean fluorescence intensity. The results of JC-1 staining are presented as the ratio of the mean fluorescence intensity of JC-1 monomers (green) to the mean fluorescence intensity of JC-1 aggregates (red). h Western blotting and statistical analysis of Bcl-2, Bax, SOD, and C-CAS3 expression. GAPDH as an internal control. ns non-significant; *P < 0.05; **P < 0.01; ****P < 0.0001. DCFH-DA Dichlorofluorescin diacetate. Scaler bar: 100 μm.

