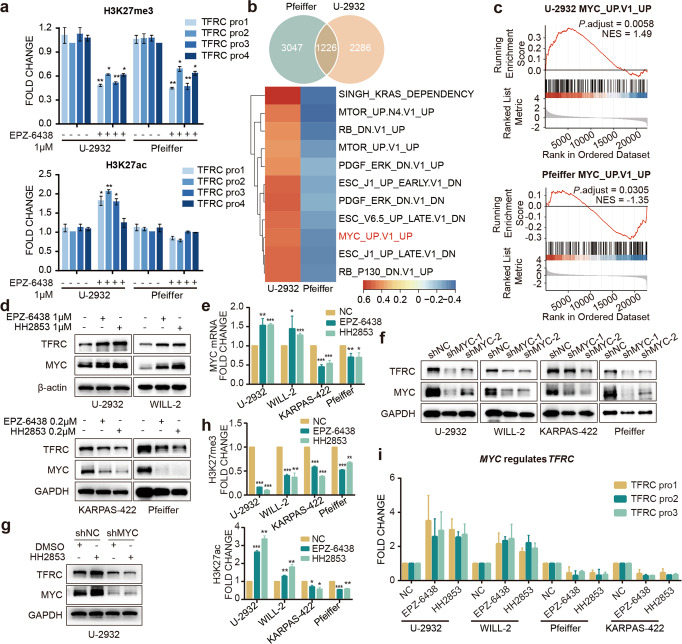
Fig. 3. EZH2i affects the expression of TfR-1 by regulating c-Myc.
a ChIP-qPCR verified the histone modification changes in the TfR-1 promoter region. b Venn diagram showing the differential expression of the statistically (P adjust < 0.05) enriched genes among the insensitive cell line U-2932 and the sensitive cell line Pfeiffer. GSEA analysis (using oncogenic c6 MSigDB gene set) of H3K27ac ChIP-seq data affected by EPZ-6438. The heatmap showing the enriched pathways (P adjust < 0.05) in the oncogenic signatures from the Molecular Signatures Database (MSigDB) with EPZ-6438 compared to DMSO treated U-2932 and Pfeiffer. The color was based on the enrichment score. c Oncogenic signature enrichment plots of H3K27ac ChIP-seq with EPZ-6438 treatment compared with DMSO treatment in U-2932. Plots indicate a significant (FDR q < 0.05) enrichment of oncogenic signatures after EPZ-6438 treatment. d, e c-Myc mRNA and protein levels were altered in cells treated with EPZ-6438 or HH2853 for 3 days. f DLBCL cells were transfected with lentivirus to deplete c-Myc expression. The indicated proteins in cells treated with or without 1 μM HH2853 were analyzed by immunoblotting (g). The histone modification changes in the MYC promoter region (h) and the c-Myc binding changes in the TFRC promoter region (i) were verified by ChIP-qPCR. The statistical analysis using Student’s t test with three biologic replicates, *P value < 0.05; **P value < 0.01, ***P value < 0.001.

