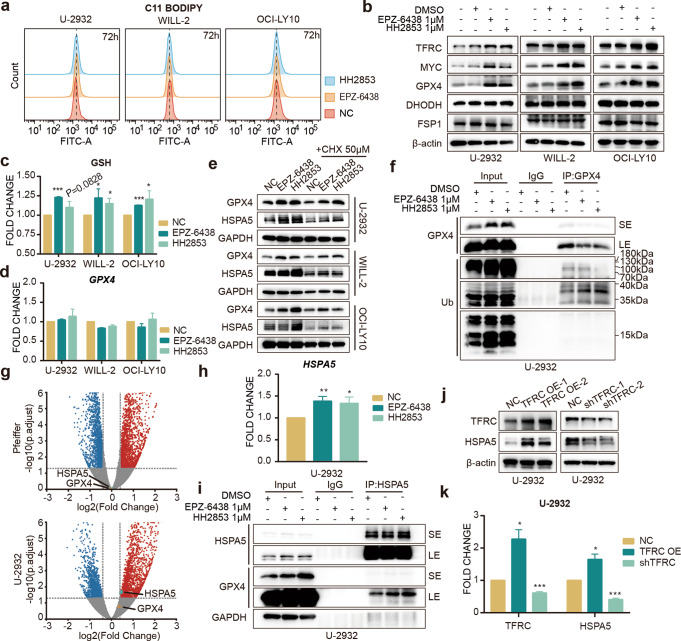
Fig. 4. EZH2i stabilizes GPX4 through HSPA5 and inhibits cell ferroptosis.
a Cells were treated with 1 μM EPZ-6438 or 1 μM HH2853 for 3 days, and lipid ROS levels were determined by C11-BODIPY (b–d). Cells were treated with EZH2i for 3 days. GPX4, DHODH, and FSP1 protein levels were detected (b) by Western blot, glutathione was determined using the GSH/GSSG Detection Assay Kit (c). and GPX4 mRNA levels were measured by RT-qPCR (d). e CHX did not reverse EZH2i-induced GPX4 and HSPA5 upregulation. f Co-immunoprecipitation (Co-IP) indicated that EZH2i cannot facilitate the GPX4 polyubiquitylation (g) Volcano plot. The volcano plot illustrates the fold changes of genes after treatment with EPZ-6438 in U-2932 and Pfeiffer cells compared to DMSO-treated cells. The corresponding adjusted p-values were calculated for the three biological replicates. The upregulated genes are shown in red, downregulated genes are shown in blue, and statistically insignificant genes are shown in gray. h EZH2i increased HSPA5 mRNA level in EZH2i resistant U-2932 cells treated with 1 μM EPZ-6438 or 1 μM HH2853 for 3 days. i Co-immunoprecipitation (Co-IP) indicated that EZH2i increased GPX4 binding to HSPA5. Cell lysates were incubated with anti-GPX4 or immunoglobulin G (IgG) antibodies. Immunoblot indicated the alteration of immunoprecipitates. SE: short exposure, LE: long exposure. Protein and mRNA levels of HSPA5 were determined in TfR-1 overexpressed and depleted U-2932 cells (j, k). The statistical analysis using Student’s t test with three biologic replicates, *P value < 0.05; **P value < 0.01, ***P value < 0.001.

