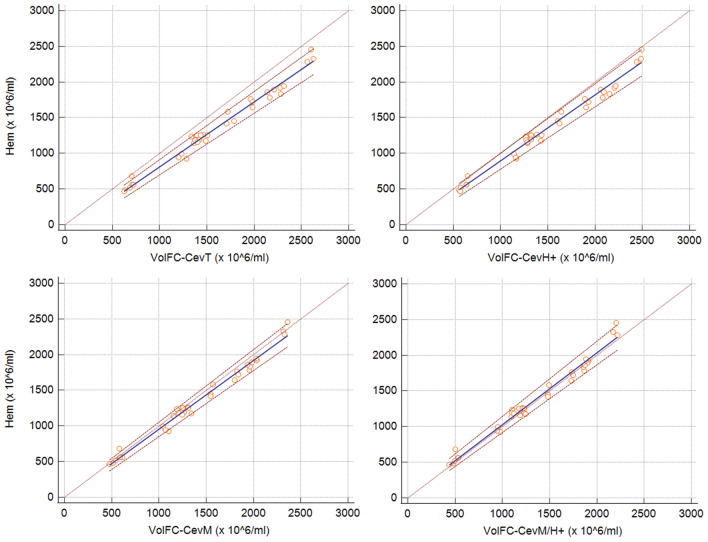
Figure 2.
Passing-Bablok regression graph showing the agreement between concentration measured with a haemocytometer (Hem) versus total events estimated with volumetric flow cytometry (volFC-CevT), events positive to Hoechst 33,342 (volFC-CevH +), events gated on sperm morphological criteria (volFC-CevM), and events gated on both sperm morphology and Hoechst positivity (volFC-CevM/H +). The dotted brown line represents the 45°-identity line (x = y), the solid blue line represents the regression line, and the dashed brown lines represent the confidence interval for the regression line. Note that Hem vs volFC-CevM/H + overlap closely with the 45 °-identity line, and Hem vs volFC-CevT is more divergent.

