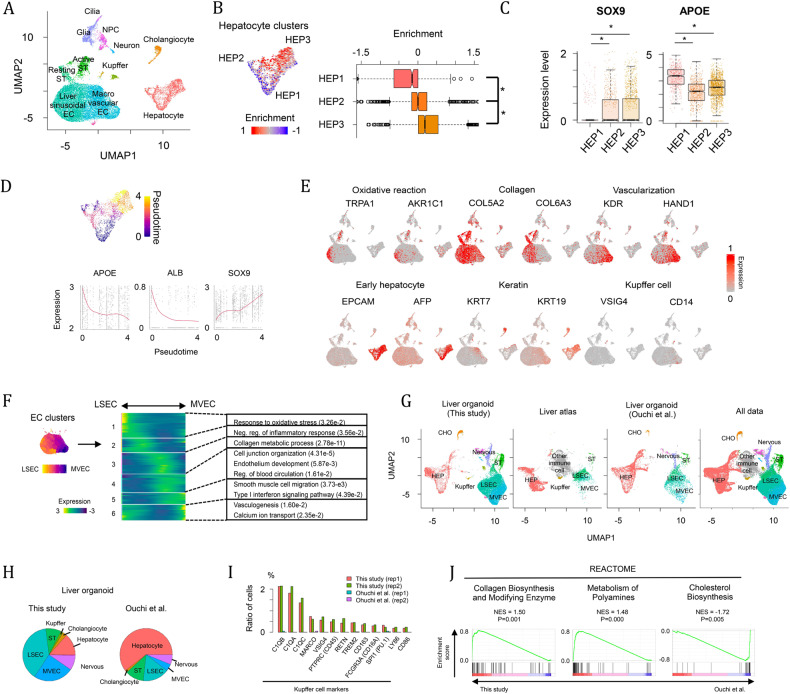
Fig. 2. Single-cell RNA sequence analysis of liver organoids.
A UMAP plot of single cells distinguished by cell type. B GSEA of gene signatures of periportal hepatocytes in hepatocyte clusters. The enrichment was compared across three hepatocyte clusters. * p < 0.05 by two-sided Student’s t test. C Differential expression of SOX9 and APOE across hepatocyte clusters, * p < 0.05 with two-sided Student’s t test. D Pseudotemporal ordering of hepatocyte clusters. SOX9 and APOE expression levels are positively and negatively correlated with pseudotime. E Heatmap showing the expression of genes related to oxidative stress, collagen, vascularization, early hepatocyte development, keratin and Kupffer cell development. F Endothelial cell ordering from LSECs to MVECs. The heatmap represents the expression pattern of genes, which are dependent on the EC ordering and categorized into six groups. Significant GO terms in each gene group are also shown. G UMAP plot of single cells derived from our and the Ouchi et al. liver organoids3 and human liver17. H Pie charts representing cell composition in our and the Ouchi et al. liver organoids. I Ratio of cells expressing Kupffer cell markers. J GSEA of pathway-related genes between our and Ouchi et al. liver organoids3. All of the above experiments were performed with the hiPSC line AG27.

