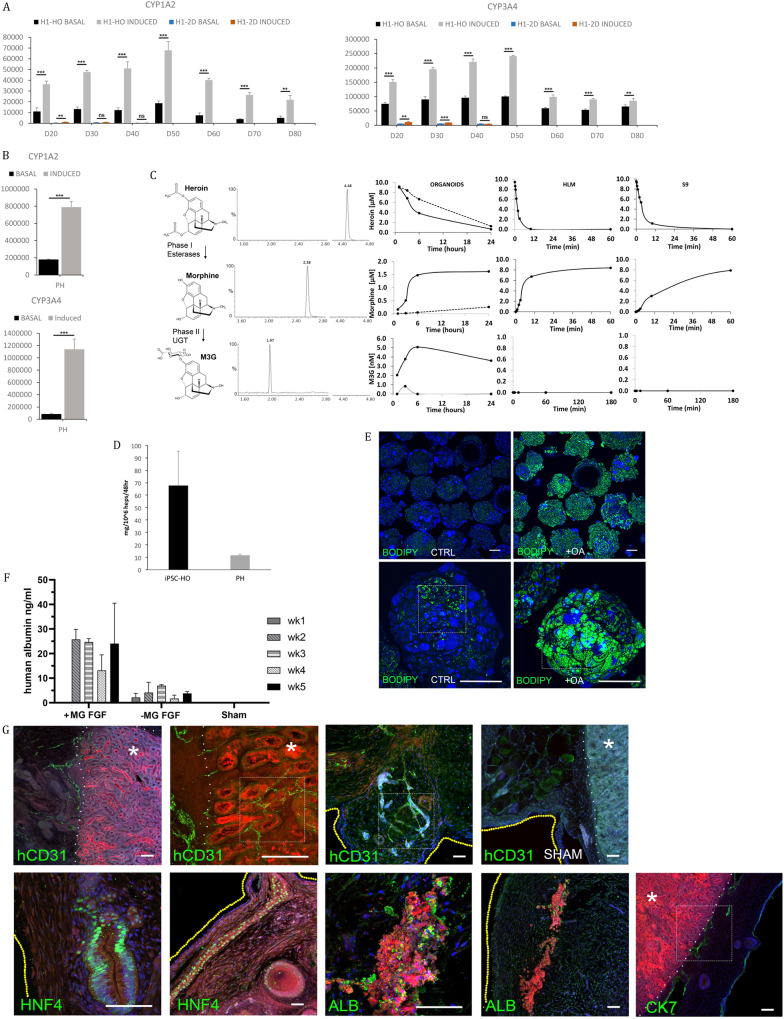
Fig. 7. Assessment of liver organoid function, maintenance and transplantability.
A Assay demonstrating inducibility and increasing activity of CYP1A2 (left side) and CYP3A4 (right side) drug metabolizing enzymes from D20 to D80 in the hESC line H1 organoids. For induction of CYP1A2, the cells were pretreated with omeprazole, and for CYP3A4, they were pretreated with rifampicin. Graphs show comparisons of suspension cultures and 2D differentiation. The results from three independent experiments are presented as the mean ± SD, ** p < 0.01, *** p < 0.001 with two-sided Student’s t test. B Assay demonstrating the activity and inducibility of CYP1A2 (top row) and CYP3A4 (bottom row) proteins in cryopreserved primary human hepatocytes. The results from three independent experiments are presented as the mean ± SD, ** p < 0.01, *** p < 0.001 with two-sided Student’s t test. C D20 AG27-derived organoids show phase I and phase II metabolism of heroin dosed at 10 μM. The left panel represents the metabolic pathway of heroin. Heroin is metabolized by sequential deacetylation (phase I reaction) to 6-monoacetylmorphine and morphine by esterase enzymes. Morphine is further glucuronidated (phase II reaction) by UDP-glucuronosyltransferases (UGTs) to morphine-3-glucuronide (M3G) and morphine-6-glucuronide (M6G). Center panel: Ion chromatograms of an extracted organoid sample analyzed by LC‒MSMS/MS. Right panel: Metabolism of heroin (10 µM) in organoids, primary human liver microsomes (HLMs) and the human S9 fraction (S9). D Demonstrating the production and secretion of urea into the culture medium from AG27-derived organoids (iPSC-HO) and primary human hepatocytes after 48 hours and normalized to mass per million hepatocytes (n = 3, mean ± SD, no urea was detectable in cell-free medium). E Whole-mount live imaging of oleic acid-treated (right column) and untreated (left column) AG27-derived organoids showing accumulation of nonpolar fats after treatment (BODIPY in green). Oleic acid was used at 300 μM for 5 days. The highlighted area is magnified in Supplementary Fig. 9. F Transplanted AG27-derived organoids can be maintained in mice. Human albumin was consistently detected over a 5-week period in mouse blood samples. D8 organoids were transplanted with either Matrigel/FGF2 supplementation ( + MG FGF) or Matrigel/FGF2 free (-MG FGF) (mean ± SD; +MG FGF n = 3, -MG FGF n = 2, sham n = 4). G Immunostaining of mouse kidney/organoid transplant cryosections demonstrates the retention of human hepatic populations (CK7, hCD31, HNF4α and ALB) and structures seen in vitro. They also demonstrated clear endothelial engraftment via hCD31 staining, whereas no hCD31-positive structures were visible in the sham group. Texas red dextran is strongly localized in the kidney parenchyma and albumin (ALB)-positive clusters of the transplanted organoids, while it is detectable at lower levels in other areas of the transplanted material. The boundary between the kidney parenchyma (marked with *) and organoid is delineated by a white dotted line, while a yellow dotted line marks the external surface. Nuclei are in blue, and all scale bars are 100 µm. Images that contain a white box have this area magnified and can be viewed in the Supplementary Fig. 9.

