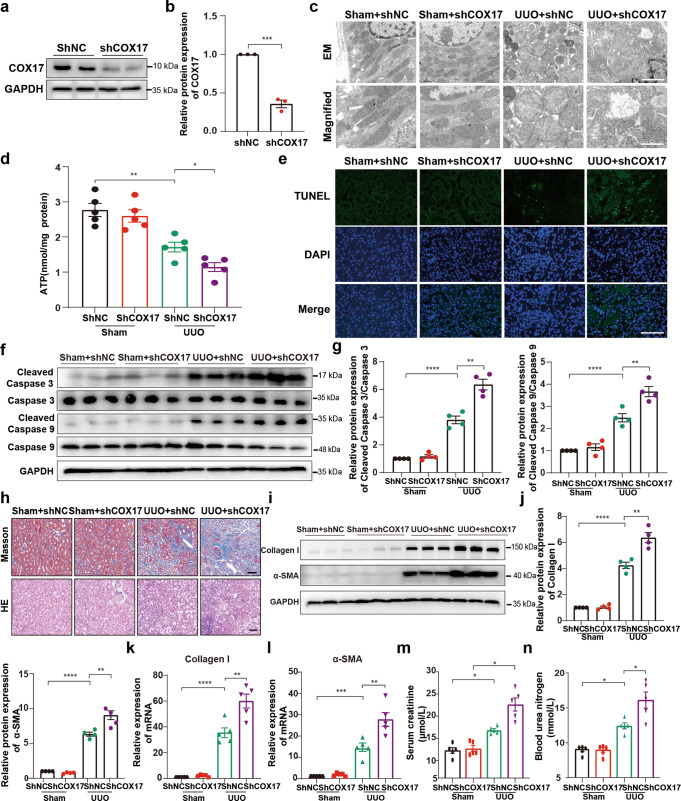
Fig. 2. Downregulation of COX17 in vivo aggravates renal fibrosis.
a Western blot and b densitometric analysis showing COX17 expression in kidney tissues transfected with AAV9-shCOX17 or AAV9-Con. c Representative TEM images of mitochondria in tubular cells at low magnification (upper panel: magnified ×7000; bar = 2 μm) and high magnification (bottom panel: magnified ×15,000; bar = 1 μm). d Quantification of ATP levels (n = 5). e Representative images for TUNEL staining of the kidney tissues. Original magnification, ×400. Bar = 100 μm. f Western blot and g densitometric analysis of the expression of caspase 3, caspase 9, cleaved caspase 3 and cleaved caspase 9 in different groups. h Masson and HE staining of renal sections from the indicated groups. Original magnification, ×200. Bar = 50 μm. i Western blot and j densitometric analysis of the expression of collagen I and α-SMA in different groups. k RT–PCR analysis of collagen I and l α-SMA in different groups. m Serum creatinine and n urea nitrogen levels in different groups (n = 5). Data are the mean ± SEM of at least three independent experiments. *P < 0.05, **P < 0.01, ***P < 0.001 and ****P < 0.0001.

