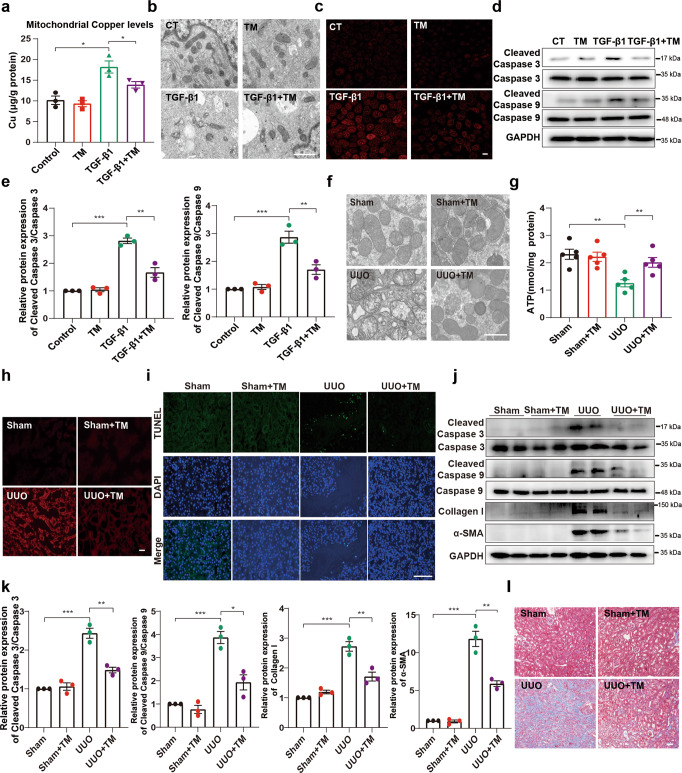
Fig. 6. Alleviating mitochondrial copper overload improves mitochondrial dysfunction, cell apoptosis and renal fibrosis.
NRK-52E cells were treated with TGF-β1 (5 ng/mL) or TM (7.5 µmol/L) as indicated. a The copper content was detected in the mitochondria of NRK-52E cells after 48 h of TGF-β1 treatment (n = 3). b Representative electron micrographs of mitochondria in NRK-52E cells (magnified ×15,000; bar = 1 μm). c Representative MitoSOX staining micrographs in different groups as indicated. d Immunoblots and e densitometric analysis of caspase 3, caspase 9, cleaved caspase 3 and cleaved caspase 9 expression in tubular cells among different groups. f Representative TEM images of mitochondria in different groups (magnified ×15,000; bar = 1 μm). g Quantification of ATP levels (n = 5). h Representative MitoSOX staining micrographs in different groups as indicated. i Representative sections of TUNEL-positive cells. Original magnification, ×400. Bar = 100 μm. j Immunoblot and k densitometric analyses of caspase 3, caspase 9, cleaved caspase 3, cleaved caspase 9, collagen I and α-SMA among different groups. l Masson staining of renal sections from the indicated groups. Original magnification, ×200. Bar = 50 μm. Each bar represents the mean ± SEM of at least three independent experiments. *P < 0.05, **P < 0.01 and ***P < 0.001.

