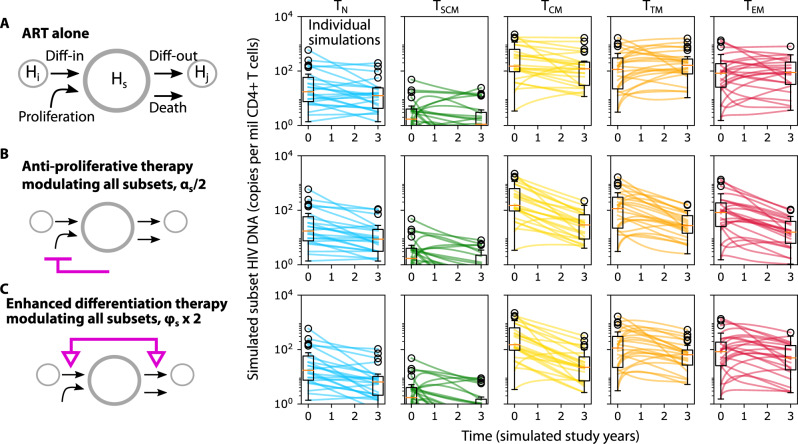
Fig. 6. Simulations of modulated HIV persistence mechanisms.
Projections of subset HIV DNA levels in all resting CD4+ T cell subsets during three theoretical therapeutic interventions: A ART alone, (B) ART and anti-proliferative therapy: 2-fold reduction in cell proliferation in all subsets, and (C) ART and enhanced differentiation therapy: 2-fold increase in cell differentiation in and out of all subsets. Box plots indicate median (center line), interquartile range (box), 1.5x interquartile range (whiskers), and outliers (open circles). Each line (N = 24) represents a simulation using parameters from each individual.

