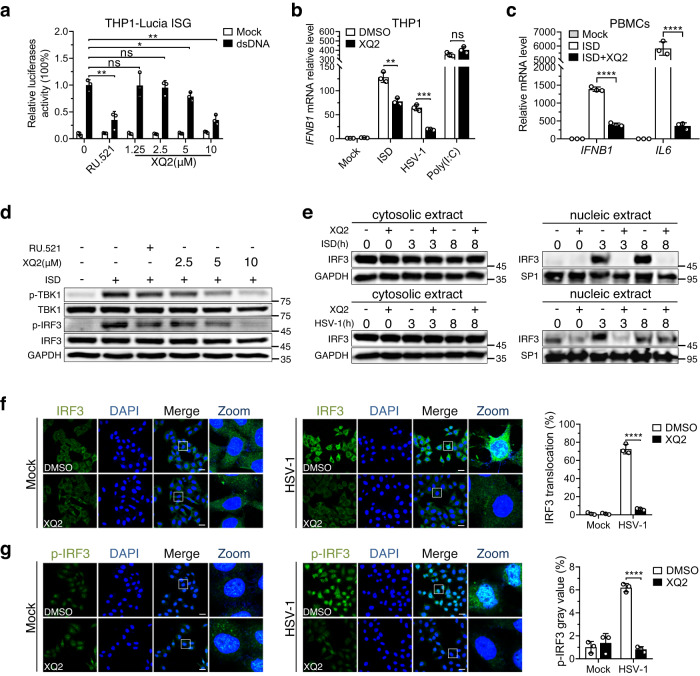
Fig. 2. XQ2 selectively inhibits dsDNA-induced signaling in human and murine cells.
a THP1 luciferase reporter cells were exposed to DMSO, RU.521 (10 μM), and the indicated doses of XQ2 for 3 h, and then stimulated with dsDNA for 24 h to promote type I interferon response. Type I interferon response was assessed by luciferase activity. p = 0.0039 (RU.521); p = 0.0426 (5 μM); p = 0.0011 (10 μM). b THP1 cells were pretreated for 3 h with DMSO or 10 μM XQ2, and then stimulated by transfection of ISD or HSV-1 infection or poly (I: C). Induction of IFNB1 mRNA was measured by qPCR. p = 0.0024 (ISD); p = 0.0003 (HSV-1). c Primary human PBMCs were pretreated for 3 h with DMSO or XQ2 (10 μM), and then stimulated with ISD. Induction of IFNB1 and IL6 mRNA was measured by qPCR. p < 0.0001 (IFNB1); p < 0.0001 (IL6). d THP1 cells pretreated for 3 h with DMSO, RU.521 or the indicated doses of XQ2, followed by stimulation with dsDNA for 6 h, and then cell lysates were analyzed for phosphorylated IRF3 and TBK1 by immunoblotting. e THP1 cells were pretreated for 3 h with DMSO or XQ2 (10 μM), and then stimulated with ISD or HSV-1 for indicated times. Cytoplasmic and nuclear fractions were extracted and immunoblotted with the indicated antibodies. SP1 and GAPDH were applied to indicate the accuracy of fractionation. f, g Hela cells were pretreated for 3 h with DMSO or XQ2 (10 μM), and then stimulated with HSV-1 for 6 h. Cells were immunostained with anti-IRF3 or anti-p-IRF3 antibody and imaged by confocal microscopy. Representative images (Left and Center); quantification of cells with nuclear IRF3 (Top and Right); quantification of cells with p-IRF3 (Bottom and Right). Scale bars represent 25 μm. p < 0.0001 (f); p < 0.0001 (g). Data are representative of three independent experiments with similar results in (d, e), or three independent experiments in (a–c, f, g). (Data are presented as mean ± SD, n = 3 independent samples in (a–c, f, g), ns, not significant, *p < 0.05, **p < 0.01, ***p < 0.001, ****p < 0.0001 using one-way ANOVA with Dunnett’s post hoc test). Source data are provided as a Source Data file.

