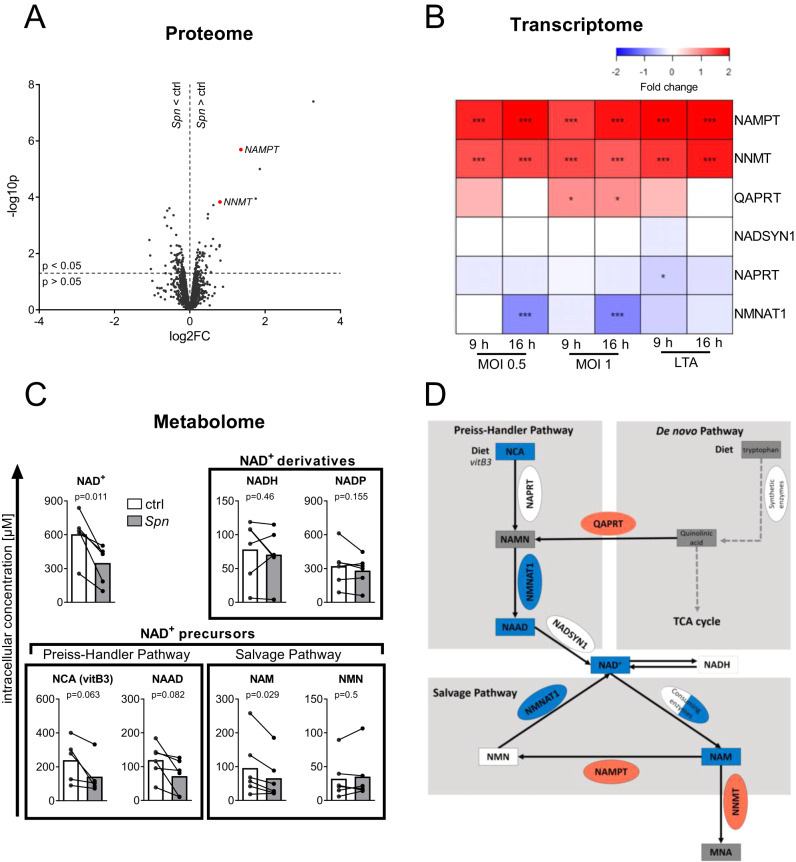
Fig. 1. NAD+ biosynthesis is dysregulated during Spn D39 infection.
A Volcano plot of protein expression upon Spn D39 infection. BEAS-2B cells were infected with Spn D39, MOI 0.5 for 16 h or left uninfected (ctrl). Afterwards, proteins were isolated and changes in protein expression were determined by SILAC proteomics. Regulated proteins associated with the NAD+ metabolism are marked in red. B BEAS-2B were either left untreated, infected with Spn D39 MOI 0.5 or 1, or treated with 1 µg/ml LTA for 9 or 16 h, respectively. RNA was isolated and gene expression was determined by mRNA microarray. NAD+ metabolism-associated genes are depicted as a heat map (value = fold change). C BEAS-2B were infected with Spn D39 MOI 1 for 16 h or left untreated. Metabolites were isolated and analyzed by LC-MS/MS. D Summary of identified regulations of the NAD+ metabolism (red: upregulation; blue: downregulation; square: metabolite; oval: enzyme). Statistics: (A, B) two-tailed, moderated t-test; (C) two-tailed paired t-test (*p < 0.05; ***p < 0.001; N = 3 biologically distinct samples (A, B); 6 biologically distinct samples (C)). MOI multiplicity of infection.

