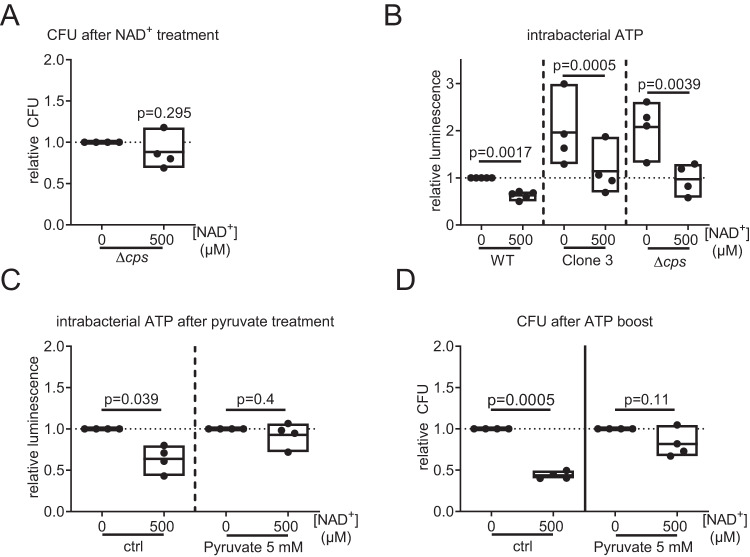
Fig. 7. Development of NAD+ resistance is associated with metabolic adaptation.
A Spn D39Δcps was treated with NAD+ for 9 h or left untreated and bacterial counts were determined. Relative bacterial counts are depicted. B Spn D39 WT, clone 3 and Spn D39Δcps were incubated in a cell culture medium for 6 h with and without NAD+ treatment. Afterwards, the intrabacterial ATP was determined by a commercial luminescence assay and normalized against bacterial counts. Measured luminescence is linear to intrabacterial ATP. C, D Intrabacterial ATP after 6 h (C) and bacterial counts after 9 h (D) of combined treatment of Spn D39 WT with 500 µM NAD+ and 5 mM pyruvate. Statistics: two-tailed t-test (A, B); Two-way-ANOVA with Fisher’s LSD (C, D); significance was determined against uninfected/untreated controls if not indicated otherwise; N = 4 biologically distinct samples; box plots: line at mean; box ranges from min to max; results are normalized against untreated controls. WT wild type.

