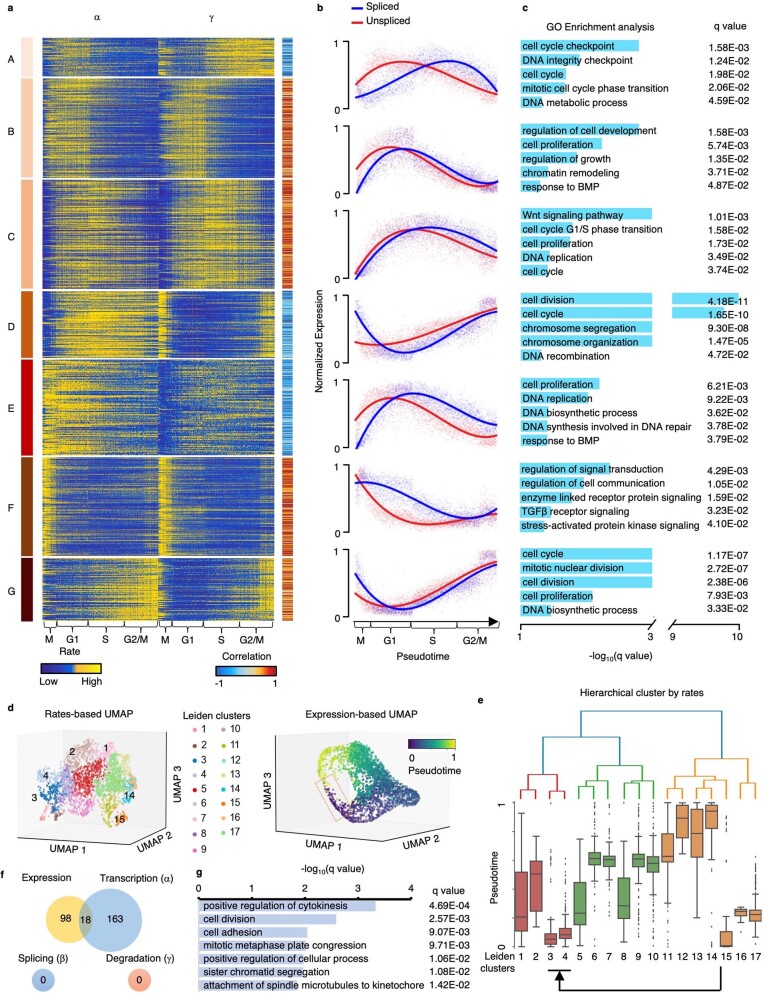
Extended Data Fig. 6. The dynamic pattern of rates identifies the different turnover strategies of genes, and cell-specific reaction rates reveal cell subpopulation uncaptured by expression.
(a) 𝛼 and γ of genes along pseudotime. Genes are clustered into seven groups according to their dynamic patterns of 𝛼 and γ. The Pearson correlation coefficients between 𝛼 and γ are calculated. (b) The normalized spliced and unspliced reads of genes along pseudotime in each clustered group. (c) The GO pathway enrichment analysis using adjusted p-values of Fisher’s Exact test (Benjamini–Hochberg procedure, one-sided, p < 0.05) for genes in each group. (d) The 3D UMAP based on 𝛼, β, and γ colored by Leiden clusters (top) and the 3D UMAP based on expression colored by cell cycle pseudotime (bottom). (e) The hierarchical tree of the Leiden clusters. The box plot (n = 3,058 cells) shows the pseudotime of each cluster. Middle line in box plot, median; box boundary, interquartile range; whiskers, 10–90 percentile; minimum and maximum, not indicated in the box plot; gray dots, individual datapoints. (f) Venn diagram of genes with significant difference (p < 0.05, FC > 1.5 or FC < 1/1.5) on expression, 𝛼, β, and γ between the clusters 3 & 4 and other clusters. (g) The GO pathway enrichment analysis using adjusted p-values of Fisher’s Exact test (Benjamini–Hochberg procedure, one-sided, p < 0.05) of DAVID for the 163 genes that only differential in 𝛼.

