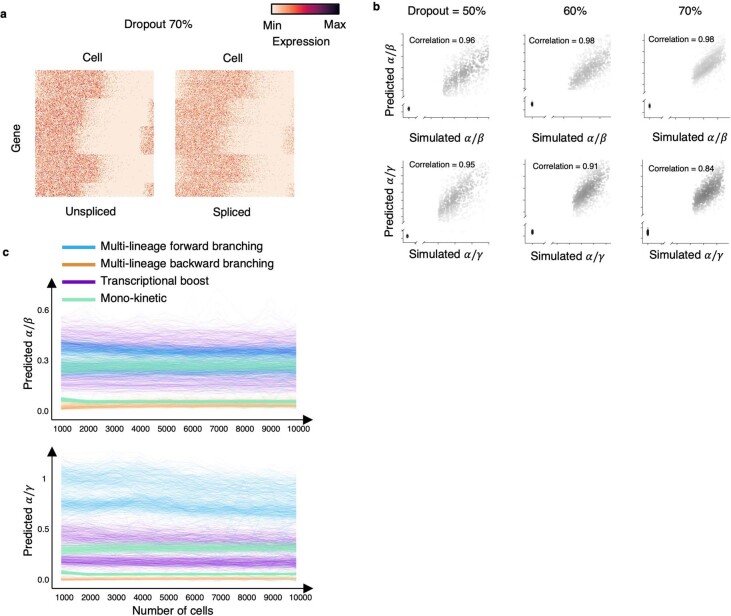
Extended Data Fig. 8. Robustness under different dropout ratios and number of cells.
(a) Heatmaps show the overview of the simulated genes with a dropout of 70% on both unspliced and spliced reads. We simulated raw mRNA counts using a Poisson distribution to obtain the unspliced and spliced abundances with 50%, 60%, and 70% technical zeros. (b) Scatter plot shows a high correlation between the simulated (background truth) and the predicted 𝛼/𝛽 (top) and 𝛼/𝛾 (bottom) under different dropout ratios of the spliced and unspliced reads. The dropout was applied to both spliced and unspliced reads. The Pearson correlation coefficients between the prediction and the simulation are computed. The Pearson correlation coefficient in data with different dropout rates is larger than 0.96 and 0.84 for α/β and α/γ, respectively. (c) The predicted 𝛼/𝛽 (top) and 𝛼/𝛾 (bottom) are plotted against numbers of cells on the simulated mono-kinetic, multi-lineage forward branching, transcriptional boost, and multi-lineage backward branching genes.

