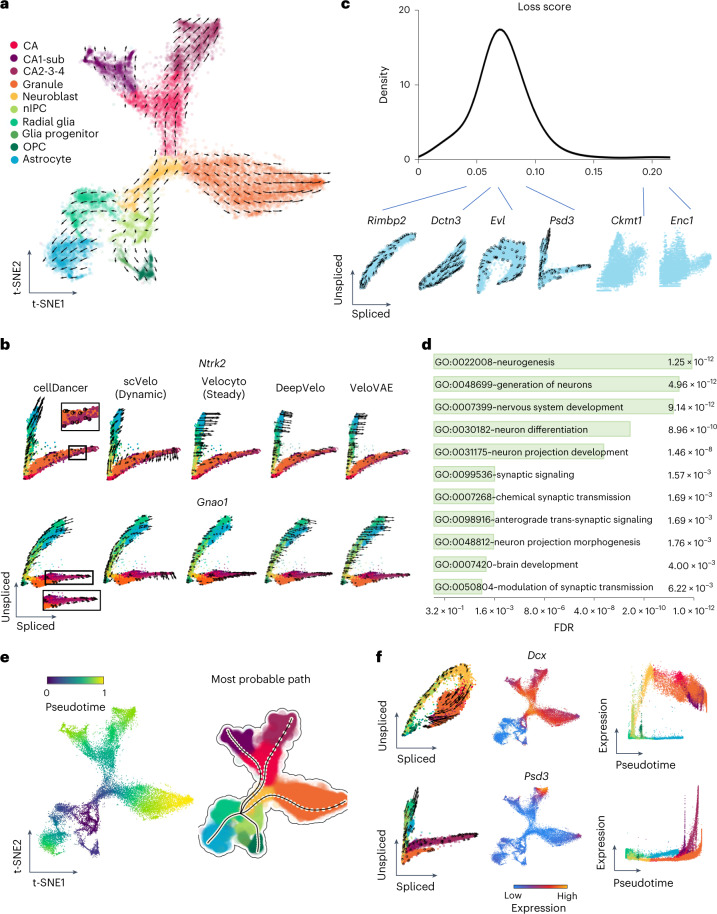
Fig. 3. Identifying the branching lineage in the hippocampus development.
a, The velocities derived from cellDancer for the mouse hippocampus development dataset are visualized on the pre-defined t-SNE embedding. Directions of the projected cell velocities on t-SNE are in good agreement with the reported directions. b, The phase portraits of two branching genes (Ntrk2 and Gnao1) predicted by cellDancer, scVelo dynamic mode, velocyto, DeepVelo and VeloVAE demonstrate the advantage of cellDancer in predicting the velocities of the branching genes. The RNA velocities of Ntrk2 and Gnao1 predicted by cellDancer are consistent with the expectation of hippocampus developmental progress, whereas the directions predicted by others are inconsistent in part. The cells are colored according to the cell types. c, Distribution of the minimized loss for all the genes. Those genes with low loss scores show mono-kinetic or divergent dynamics, whereas genes with high loss scores show pattern-less phase portraits. d, The GO pathway enrichment analysis using adjusted P values of Fisher’s exact test (Benjamini–Hochberg procedure, one-sided, P < 0.05) of DAVID for the 500 genes with the lowest training loss score shows that these genes are highly involved in pathways associated with nervous and brain development. e, Gene-shared pseudotime is projected on t-SNE by cellDancer, and the most probable paths are inferred by dynamo, showing the order of cell differentiation during hippocampus development. f, The phase portraits (left, cells colored according to a), the expression on t-SNE embedding (middle) and the expression pseudotime profiles (right) for the genes Dcx and Psd3. Dcx (top) and Psd3 (bottom) have distinct dynamic behaviors. Dcx is a mono-kinetic gene (left), and its expression gradually increases in neuroblasts (right). Psd3 is a branching gene (left), and its expression increases in each branching lineage at different speeds (right). FDR, false discovery rate; nIPC, neural intermediate progenitor cell.

