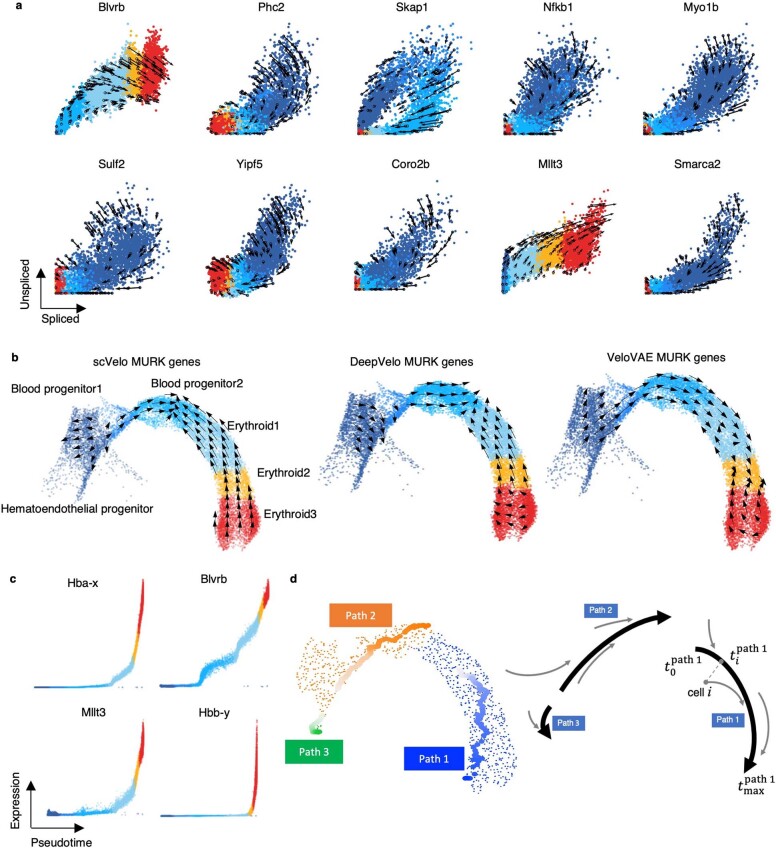
Extended Data Fig. 2. RNA velocity estimation for the multiple rate kinetics (MURK) genes in the gastrulation erythroid maturation dataset.
(a) RNA velocities predicted by cellDancer are projected onto the spliced-unspliced phase portraits for a set of selected genes. (b) The velocities derived from scVelo dynamic model, DeepVelo, and VeloVAE for gastrulation erythroid maturation cells using MURK genes are visualized on the pre-defined UMAP embedding. Inverted flows from the erythroid 3 to the blood progenitors 2 cell type are observed for the scVelo and DeepVelo predictions; inverted flows from the erythroid 3 to the erythroid 1 cell type are observed for the VeloVAE prediction. (c) Expression pseudotime profiles for four MURK genes Hba-x, Blvrb, Mllt3, and Hbb-y show the expression patterns of transcriptional boost in gastrulation erythroid maturation. (d) Long trajectories used for pseudotime estimation in gastrulation erythroid maturation are visualized on the UMAP embedding. The long trajectories are local maxima of traverse length and are colored from light to dark according to their unadjusted pseudotime. The schematic diagram demonstrates how the unadjusted pseudotime of cells is determined according to the time in the long trajectories. The black bold lines stand for the long trajectories and the pseudotime for the originating cells of the short trajectories (gray lines) is obtained as the time of the closest cell in the corresponding long trajectory.

