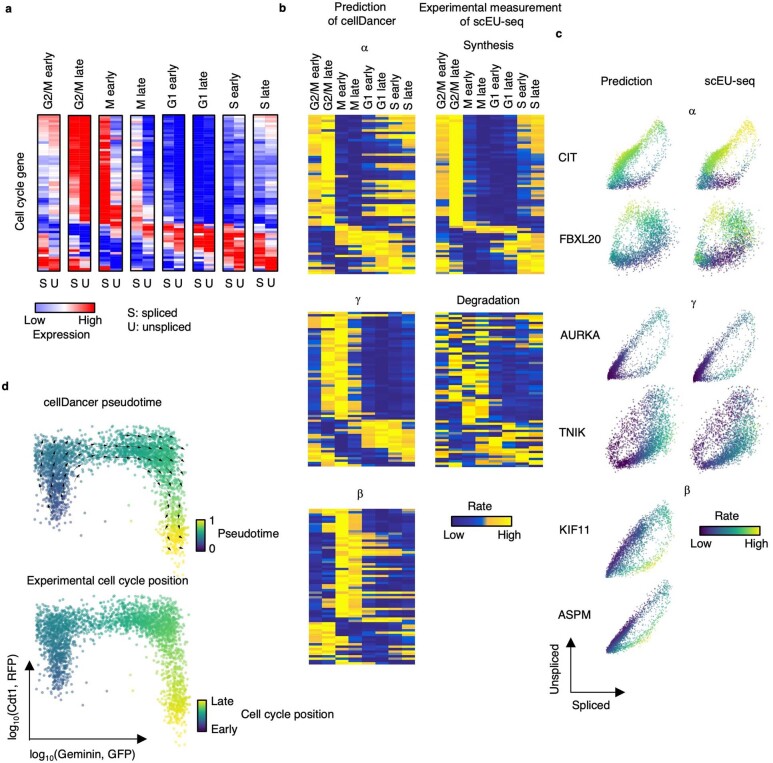
Extended Data Fig. 5. Revealing the turnover strategies of mRNA in the cell cycle process.
(a) The spliced and unspliced reads of cell cycle genes in the cell cycle progression. The averaged spliced and unspliced reads were calculated for each cell cycle group. (b) Heatmaps show 𝛼, β, and γ estimated by cellDancer (first column) is associated with the experimentally derived synthesis and degradation status in scEU-seq (second column) in the cell cycle progress. (c) The phase portraits of cell cycle genes show the predicted kinetic parameters are related to experimental measurements in scEU-seq. (d) The velocities derived from cellDancer for metabolic labeling dataset are visualized on the relative position along the cell cycle using the Geminin-GFP and the Cdt1- RFP signals from the FUCCI system. Gene-shared pseudotime on the relative position is consistent with the experimental cell cycle position.

