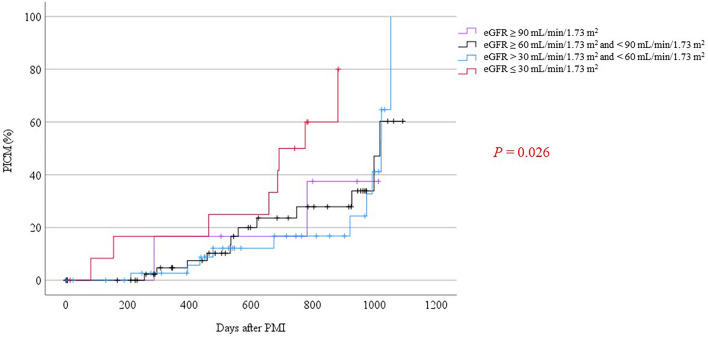
Figure 2.
Incidence of PICM in patients with chronic kidney disease. Kaplan–Meier curves are shown for the development of PICM over 3 years of follow-up. The eGFR was categorized into four groups: eGFR ≥ 90 mL/min/1.73 m2, eGFR ≥ 60 mL/min/1.73 m2 and < 90 mL/min/1.73 m2, eGFR > 30 mL/min/1.73 m2 and < 60 mL/min/1.73 m2, and eGFR ≤ 30 mL/min/1.73 m2. A significant difference in the incidence of PICM among the four groups was detected. PICM pacing-induced cardiomyopathy, eGFR estimated glomerular filtration rate (mL/min/1.73 m2).

