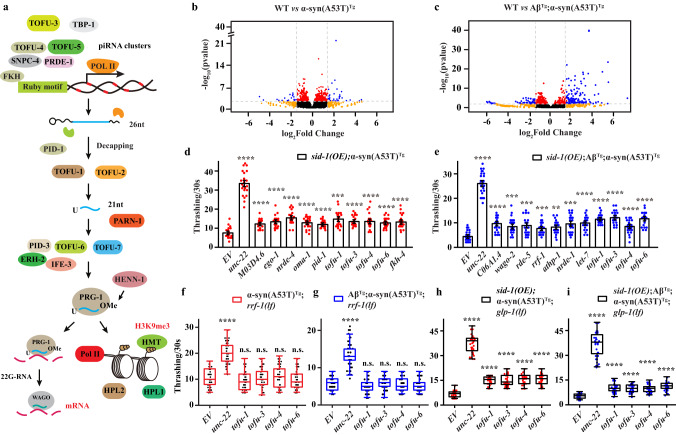
Fig. 1. RNAi screening in transgenic animals.
a Schematic diagram of piRNA biogenesis in C. elegans. b, c Volcano plot of piRNAs expression in small RNA-Seq. Red dots, P value < 0.01, FDR < 0.05; orange dots, |log2(fold change)| > 1.5; blue dots, P value < 0.01, FDR < 0.05 and |log2(fold change)| > 1.5; black dots, P value ≥ 0.01, FDR ≥ 0.05 and |log2(fold change)| ≤ 1.5. d, e Thrashing assay in young adult stage of sid-1(OE);α-syn(A53T)Tg and sid-1(OE);AβTg;α-syn(A53T)Tg strains under different RNAi clones (n ≥ 12 for each clone). Data are presented as mean ± SEM. f–i Thrashing assay in the young adult stage of different strains under tofu-1, tofu-3, tofu-4, and tofu-6 RNAi clones (n ≥ 12 for each clone). The box plots display the median, upper, and lower quartiles; the whiskers show a 1.5× interquartile range (IQR). For (d–i), each dot represents one nematode. EV was an empty vector (negative control), and unc-22 was a positive control in the RNAi screen. p-values were determined by one-way ANOVA analysis. ****P < 0.0001, ***P < 0.001, **P < 0.01, n.s. not significant. Source data are provided as a Source Data file.

