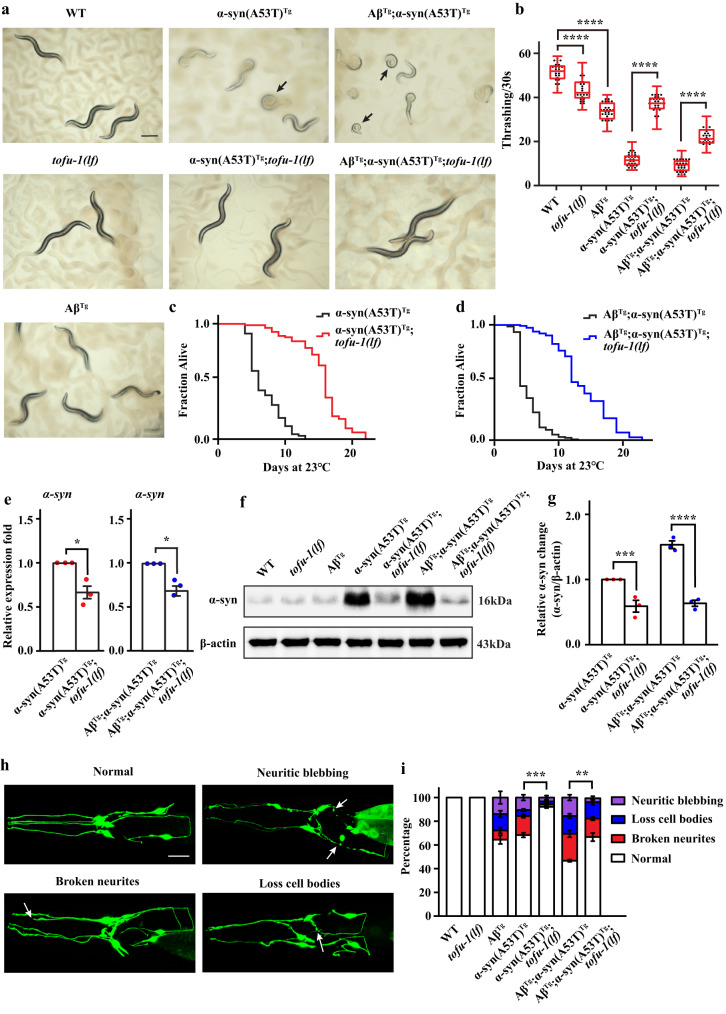
Fig. 2. TOFU-1 deletion ameliorates behavioral impairments in transgenic animals.
a Transmitted light microscopy images of transgenic animals on agar plates. Black arrows indicate transgenic animals with severe postural deficits. Scale bar = 250 μM. b Thrashing assay of WT and transgenic animals at young adult stage (n ≥ 12 for each group). The box plots display the median, upper, and lower quartiles; the whiskers show 1.5× interquartile range (IQR). c, d The survival curve of transgenic animals (n ≥ 70 for each group). The average lifespan was analyzed by Kaplan–Meier test, P value was calculated by the log-rank test. e Gene expression of α-syn in transgenic animals (mean ± SEM, n = 3). f, g Western blot analysis of α-syn expression in transgenic animals at young adult stage (mean ± SEM, n = 3). h Confocal imaging of normal, neuritic blebbing, broken neurites, and loss cell body in head dopaminergic neurons in transgenic animals. Typical examples are shown. White arrows indicate the location of the lesion. Images were obtained using Zeiss confocal microscope LSM710 at 400× magnification. Scale bar = 20 μM. i Quantitation of dopaminergic neuron lesions on day 8 adults (n ≥ 60 for each group). Statistical analysis was conducted for the normal ratio in dopaminergic neurons in transgenic strains, three biological replicates (mean ± SEM). For (b, g, i), p-values were determined by one-way ANOVA analysis. For (e), p-values were determined by two-tail student’s t-test. ****P < 0.0001, ***P < 0.001, **P < 0.01, **P < 0.001, *P < 0.05. Source data are provided as a Source Data file.

