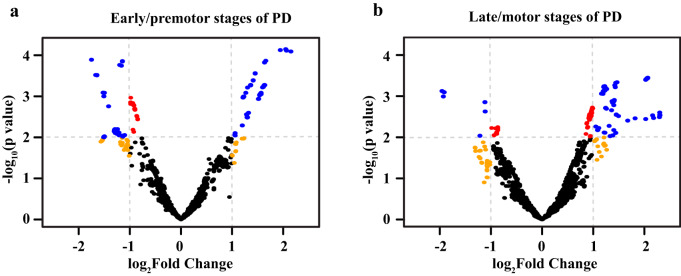
Fig. 5. piRNAs expression in PD patients.
a, b Volcano plot of piRNA expression in premotor and motor stages of PD patients. Data were obtained from GEO database (GSE97285) which includes 7 early premotor PD, 7 late motor stage PD, and 14 control samples. Red dots, P value < 0.01; orange dots, |log2(fold change)| > 1; blue dots, P value < 0.01 and |log2(fold change)| > 1; black dots, P value ≥ 0.01 and |log2(fold change)| ≤ 1. Data are provided in Supplementary Data 6.

