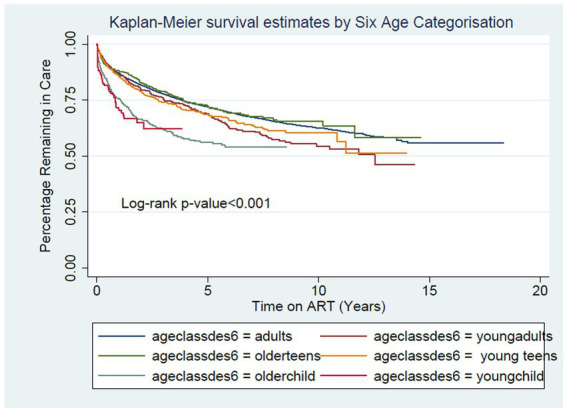
Figure 1.

Crude Kaplan Curve showing percentage remaining in care by 6 age categorization [Adults (n = 22,006) Young Adults (n = 972) Older Adolescents (n = 978) Young Adolescents (n = 1,312) Older Child (n = 1,019) Young Children (n = 219)] when outcome of interest is defaulting.
