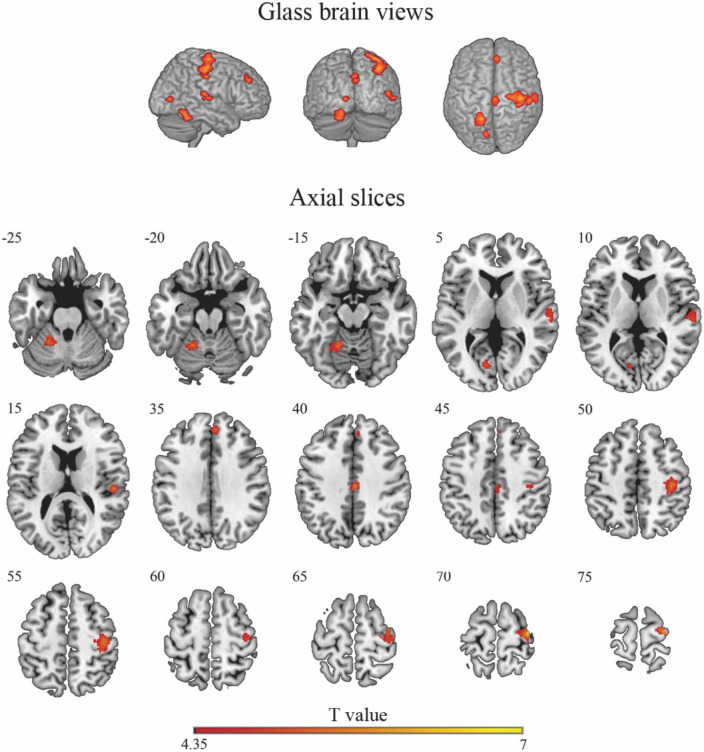
FIGURE 2.
Glass-brain views (top panel) and axial maps (bottom panel) displaying brain areas with a statistically significant increased BOLD signal for the risky > non-risky contrast. Note that glass-brain images show projections of the activations across the whole brain volume onto two-dimensional axial, sagittal, and coronal views.

