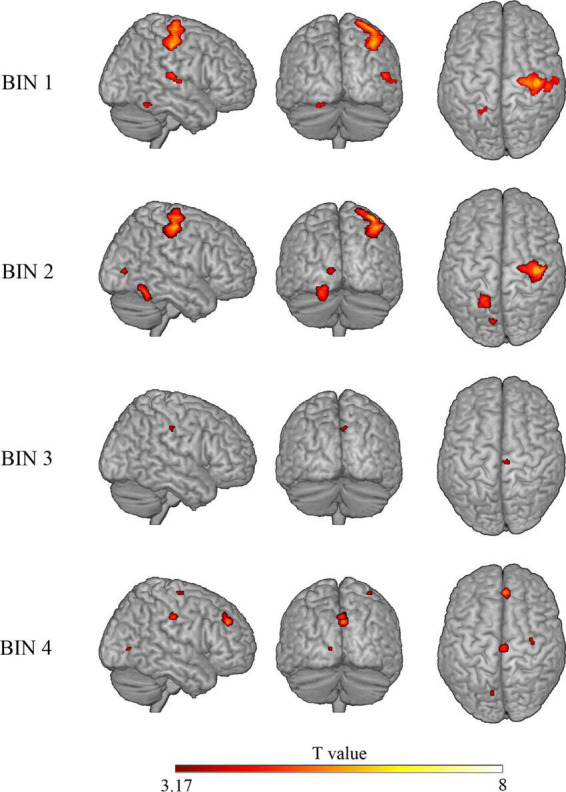
FIGURE 3.

Glass-brain views (sagittal, coronal, and axial) displaying brain areas with a statistically significant increased BOLD signal in the risky > control contrast for each of the four bins. Analysis is restricted to clusters showing significant differences in the “risky > control” contrast on the whole trial.
