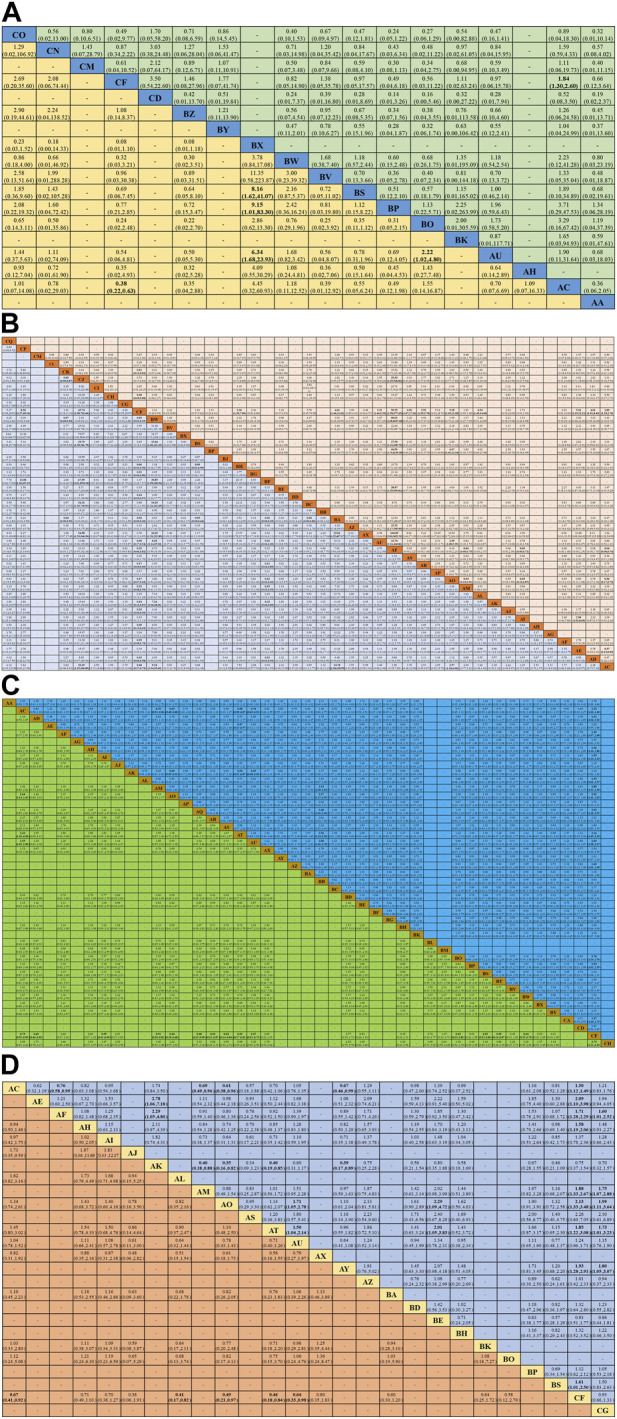
FIGURE 3.

Summary of network meta-analysis. (A) Combined odds ratio (95% onfidence interval) of ORR (upper triangle) and ≥3 AEs (lower triangle) for IC combined with CCRT regimens; (B) Combined hazard ratio (95% onfidence interval) of ORR (upper triangle) and ≥3 AEs (lower triangle) for systemic treatment with concurrent RT regimens; (C) Combined hazard ratio (95% confidence interval) for OS (upper triangle) and PFS (lower triangle); (D) Combined hazard ratio (95% confidence interval) for LRC (upper triangle) and DFS (lower triangle). The data in each cell is a risk ratio or hazard ratio (95% confidence interval) that is used to compare the column versus the row. Statistically significant results are shown in bold.
