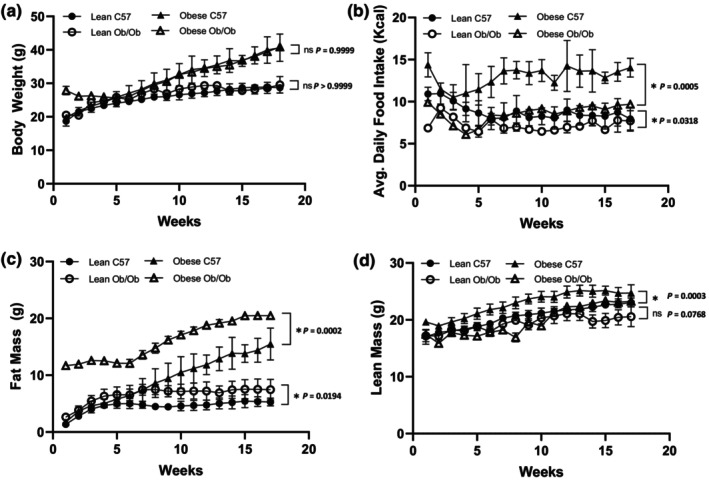
FIGURE 1.

Body composition of male C57 and weight‐paired lean or obese Ob/Ob mice. Lean C57, Lean Ob/Ob, and Obese Ob/Ob were fed a control diet (CD), Obese C57 were fed a high fat diet (HFD). (a). Body weight (g); (b). Average daily food intake in Kcal; (c). Fat Mass (g); (d). Lean mass (g). Mean ± STDev., n = 4/group. One‐Way ANOVA or Kruskal–Wallis; *p ≤ 0.05.
