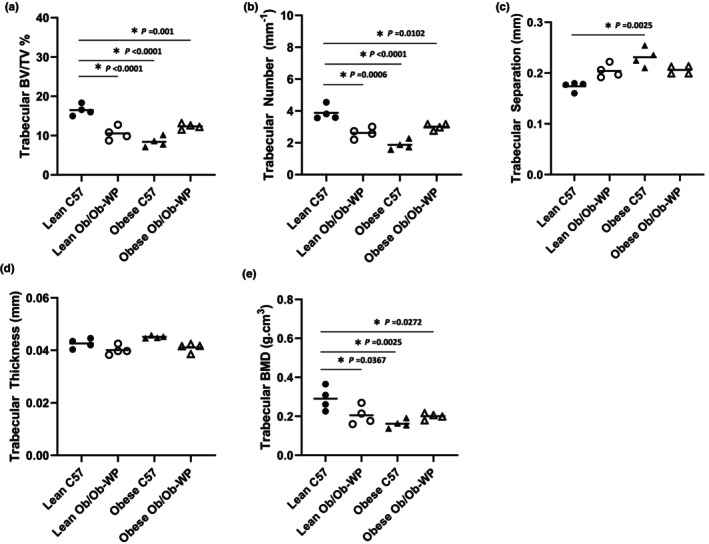
FIGURE 3.

Proximal tibia trabecular bone morphology at 24 ± 2 weeks of age of male C57 and weight‐paired lean or obese Ob/Ob mice. (a). Trabecular bone volume/tissue volume (BV/TV) (%); (b). Trabecular number (mm−1); (c). Trabecular separation (mm); (d). Trabecular thickness (mm); (e). Trabecular bone mineral density (BMD) (g/cm3). n = 4 Mean and individual data points. One‐way ANOVA or Kruskal–Wallis with post hoc multiple comparisons, *p ≤ 0.05 vs. Lean C57.
