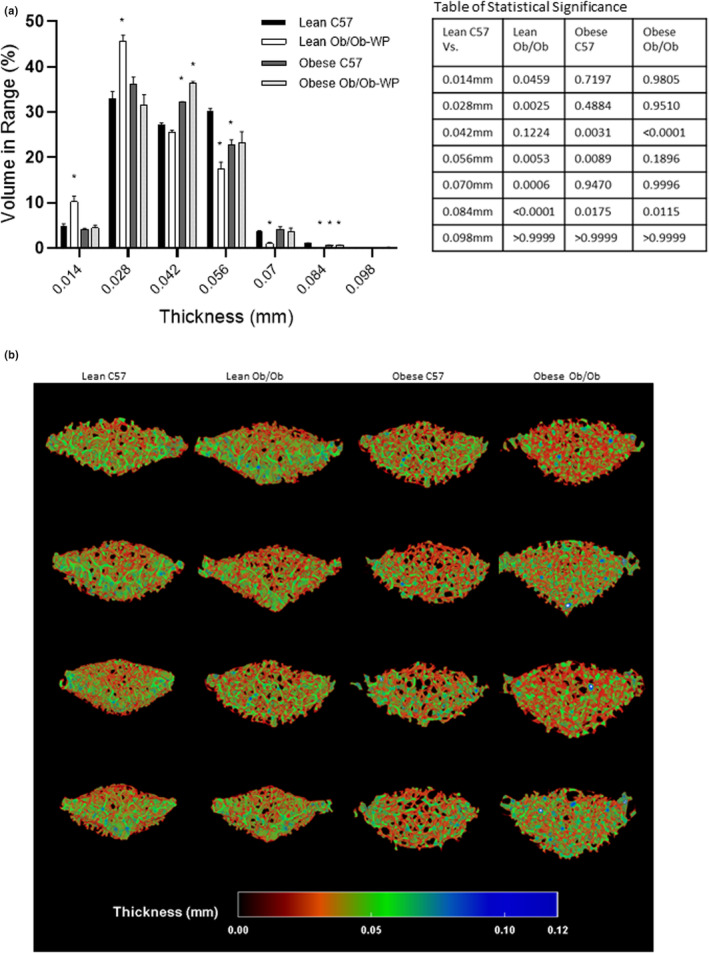
FIGURE 8.

Vertebral trabecular bone morphology at 24 ± 2 weeks of age of male C57 and weight‐paired lean or obese Ob/Ob mice. (a). Thickness distribution (mm) plus table of statistical significance; (b). 3D color‐coded thickness map (mm). n = 4 Mean and individual data points. One‐way ANOVA or Kruskal–Wallis with post hoc multiple comparisons, *p ≤ 0.05 vs. Lean C57.
