. 2023 Sep 5;308(3):e223255. doi: 10.1148/radiol.223255

Figure 5:

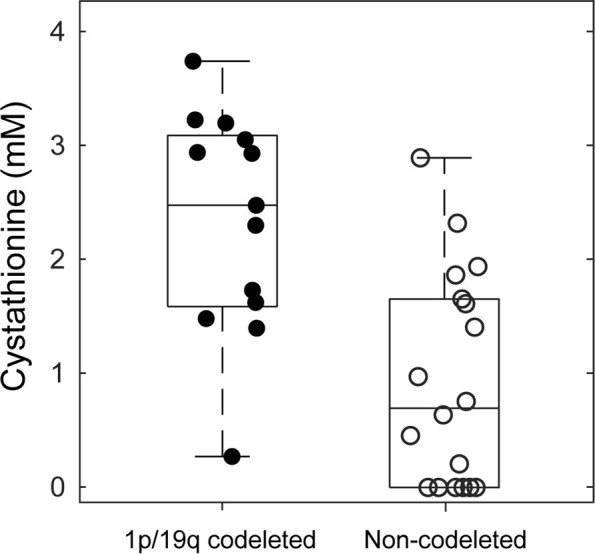
Box plots of cystathionine concentrations in 1p/19q codeleted (filled circles) versus noncodeleted gliomas (empty circles). For each box, the midline indicates the median concentration, and the bottom and top edges indicate the 25th and 75th percentiles, respectively. Circles represent values from individual patients with gliomas. Whiskers indicate the highest and lowest data points.

Box plots of cystathionine concentrations in 1p/19q codeleted (filled circles) versus noncodeleted gliomas (empty circles). For each box, the midline indicates the median concentration, and the bottom and top edges indicate the 25th and 75th percentiles, respectively. Circles represent values from individual patients with gliomas. Whiskers indicate the highest and lowest data points.