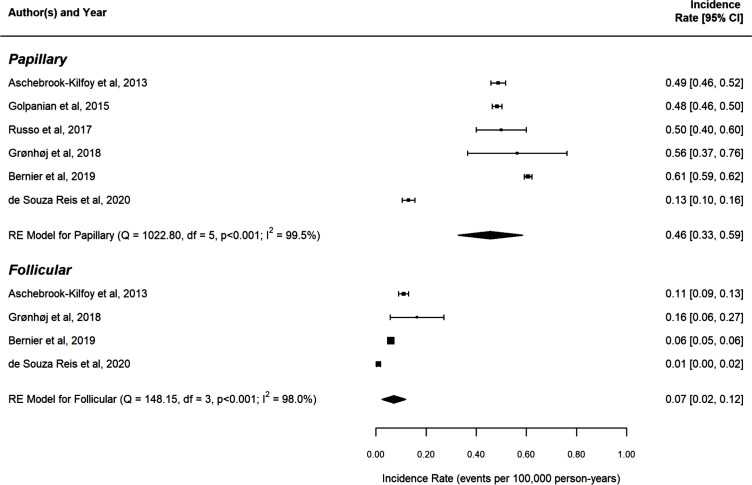
Figure 2.
Forest plot of the thyroid carcinoma incidence rates, reported in each study (during its “study period”) per 100,000 person-years along with their 95% confidence intervals, stratified by thyroid carcinoma types (subgroups). Each square corresponds to the study-specific incidence rate (IR) estimate and its size is proportional to the inverse of the IR variance (ie the narrower the confidence interval, the targer the size of the square). The pooled estimate (centre line of diamond) and its confidence interval (lateral tips of diamond) are shown at the end of each subgroup. RE: Random-effects model (ie the pooled estimate was computed from a linear mixed-effects with a random intercept), Q: the value of Cochran's Q test, which follows a Chi-Square distribution with degrees of freedom (df) equal to the number of studies minus one p: p-value associated to the Q-test I2: the percentage of vanation across studies that is due to heterogeneity rather than chance and it is computed as follows: I2= P 100% x (Q-d)/Q.

