
Figure 7.
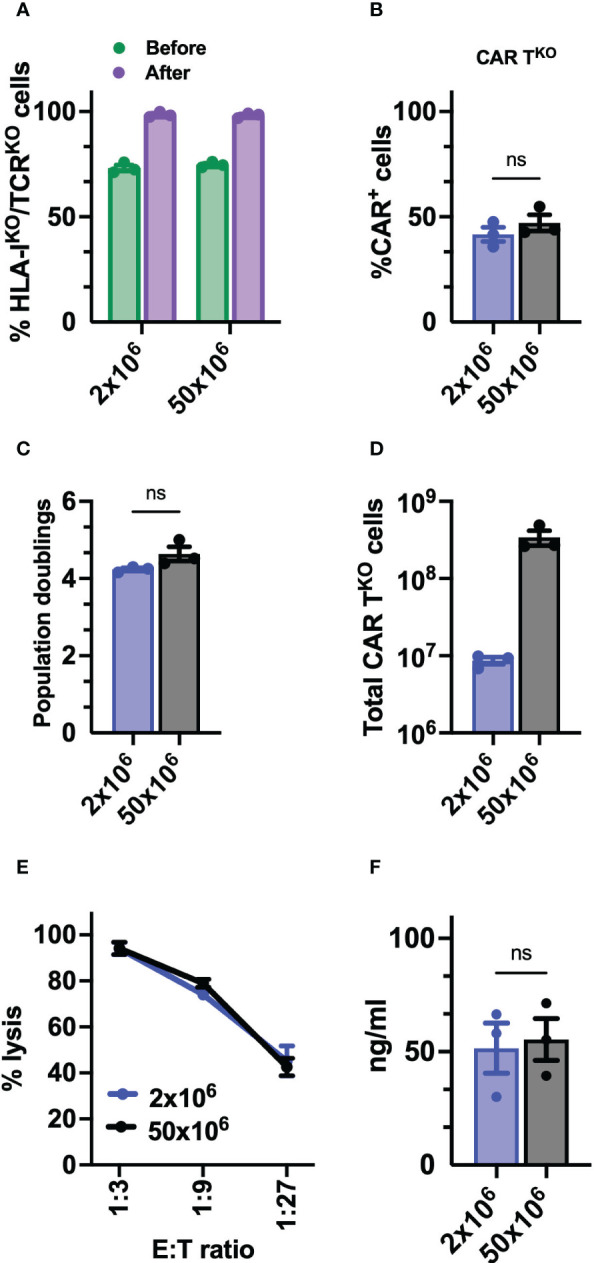
Preclinical production of HLA-IKO/TCRKO CD33-CAR-T cells. (A) Percentage of HLA-IKO/TCRKO double negative cells before and after selection (n=3 independent productions). (B) Percentage of transduced cells (CAR+) at the CAR-TKO cell production after selection of HLA-IKO/TCRKO double negative cells (n=3 independent productions). (C) Population doublings of CAR-TKO cells during CAR-T cell production (n=3 independent productions). (D) Quantification of total number of CAR-TKO cells obtained at the end of the production after HLA-IKO/TCRKO double negative selection (n=3 independent productions). (E) Quantification of the cytotoxic activity of CAR-TKO cells against CD33+ MOLM-13 AML cell line at different E:T ratio. The percentage of specific lysis (average of three technical replicates) for each CAR-T cell productions (n=3) is depicted. (F) Quantification of IFN-γ levels in supernatants from cytotoxic assays (ratio 1:3) measured by ELISA. The cytokine concentration (ng/ml; average of three technical replicates) for each CAR-T cell production (n=3) is depicted. Mann Whitney test (B, C, F), 2-way ANOVA with Tukey’s multiple comparisons test (E). ns, not significant.