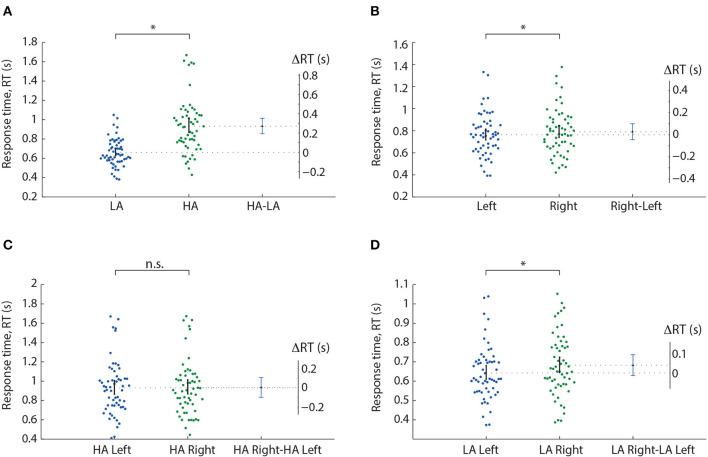
Figure 2.
Response time analysis in the Experiment 1. A result of the post-hoc comparisons of the median RT between HA and LA stimuli (A), left- and right-oriented stimuli (B), left- and right-oriented HA stimuli (C), and left- and right-oriented LA stimuli (D). Scatter-plot show the median RTs of all subjects, error-bar demonstrates a 95% confidence interval (CI). Difference between groups is shown by the mean value and 95% CI. *p < 0.05 (uncorrected) via a repeated measures ANOVA and the post-hoc t-test. n.s., not significant.

