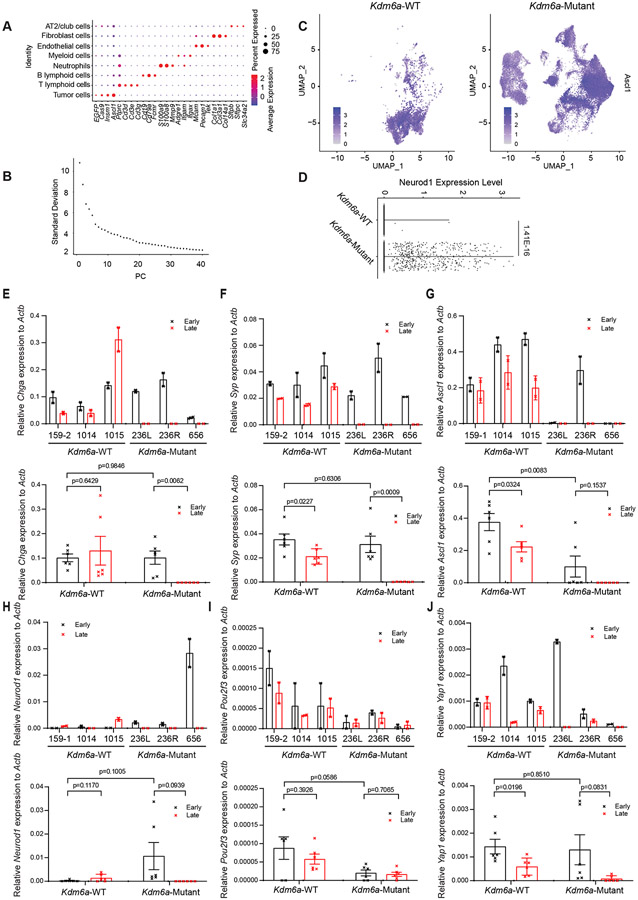
Extended Data Fig. 4. Additional scRNA-seq Data from Kdm6a-Mutant vs. Kdm6a-WT Tumors from Fig. 3 and Additional RT-qPCR Data from Tumor Derived Cell Lines from Fig. 4.
(a) Dot plot showing the average expression of marker genes to identify immune cell subpopulations of all cells in Fig 3h. The size of the dot represents the percentage of cells expressing a particular gene while color represents the mean gene expression levels (blue is low and red is high). (b) Elbow plot showing the standard deviation associated with the top 40 PCs in the tumor population. (c) Feature plot of Ascl1 of all tumor cells from scRNA-seq data in Kdm6a-Mutant vs. Kdm6a-WT (see Fig. 3i). (d) Neurod1 violin plot using scRNA-seq data from Fig. 3j of tumor cells from Kdm6a-Mutant and Kdm6a-WT tumors. For d, non-parametric Wilcoxon rank sum test was used to generate a two-tailed p-value adjusted for multiple comparisons by Bonferroni correction. n=35,446 Kdm6a-Mutant and n=6,612 Kdm6a-WT tumor cells. Each individual dot represents a cell. (e-j) RT-qPCR for Chromogranin A (e), Synaptophysin (f), Ascl1 (g), Neurod1 (h) Pou2f3 (i) and Yap1 (j) mRNA expression in the early vs. late passage tumor-derived cell lines of individual Kdm6a-WT and Kdm6a-Mutant (upper graphs) or average mRNA expression in Kdm6a-WT vs. Kdm6a-Mutant cell lines (lower graphs). n=6 biological independent experiments for each genotype (2 biological independent experiments for each cell line). Data are presented as mean values ± SEM. Statistical significance was calculated using unpaired, two-tailed students t-test and p-values are indicated on each figure panel. For all t-tests comparing Kdm6a-Mutant vs. Kdm6a-WT cell lines, all early passage Kdm6a-Mutant were compared to all early passage Kdm6a-WT cell lines.

