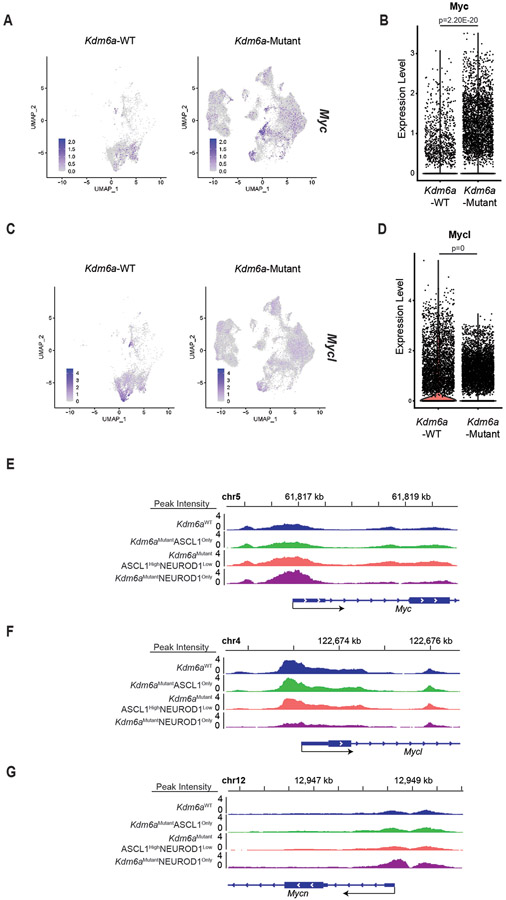
Extended Data Fig. 6. Myc and Mycl mRNA Expression and Chromatin Accessibility in Kdm6a-Mutant vs. Kdm6a-WT Tumors.
(a-d) Feature plots with violin plot of single cells from tumors for Myc (a,b) and Mycl (c,d) expression from scRNA-seq data from Fig. 3i. For b,d, non-parametric Wilcoxon rank sum test was used to generate two-tailed p-values adjusted for multiple comparisons by Bonferroni correction. n=35,446 Kdm6a-Mutant and n=6,612 Kdm6a-WT tumor cells. Each individual dot represents a cell. Minimum and maximum values defined the range of violin plot. (e-g) Chromatin accessibility tracks for the average of each phenotype indicated (see Figs. 3c-g) at Myc (e), Mycl (f) and Mycn (g) from all ATAC-seq data from Fig. 3d.

