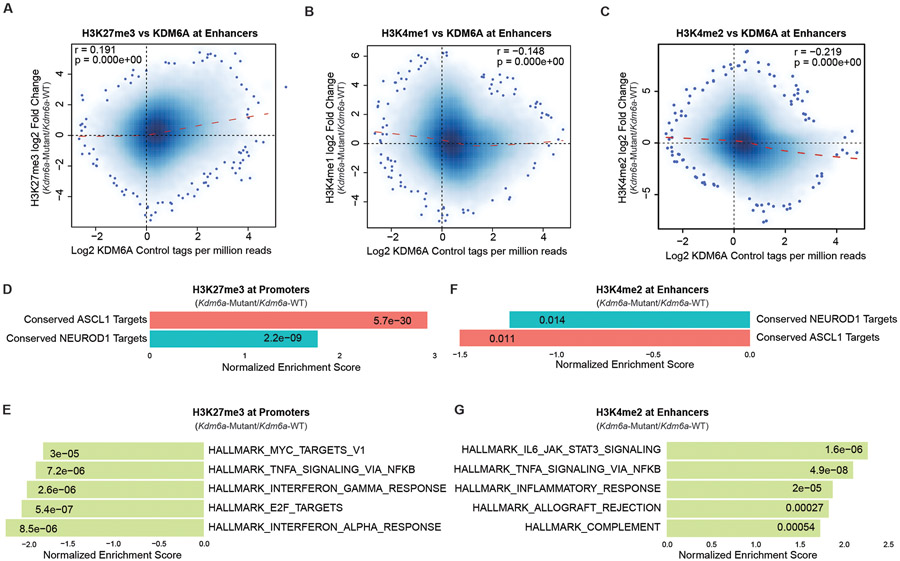
Extended Data Fig. 8. Correlation and GSEA Analyses of KDM6A, H3K27me3, H3K4me1, and H3K4me2 ChIP-seq Data in Kdm6a-WT and Kdm6a-Mutant SCLC Primary Cell Lines.
(a) Genome-wide correlation of log fold change in H3K27me3 ChIP-seq (Kdm6a-Mutant/Kdm6a-WT) vs. log fold change in KDM6A ChIP-seq at enhancers. (b) Genome-wide correlation of log fold change in H3K4me1 ChIP-seq (Kdm6a-Mutant/Kdm6a-WT) vs. log fold change in KDM6A ChIP-seq at enhancers. (c) Genome-wide correlation of log fold change in H3K4me2 ChIP-seq (Kdm6a-Mutant/Kdm6a-WT) vs. log fold change in KDM6A ChIP-seq at enhancers. For a-c, r Pearson correlation coefficient and p-value are indicated. p-values were calculated using a two-sided Pearson’s correlation test and are indicated. (d, e) Normalized Enrichment Score from GSEA of H3K27me3 ChIP-seq at transcription start sites of conserved ASCL1 target genes or conserved NEUROD1 target genes (d) or top 5 enriched Hallmarks (e) from the ChIP-seq data in Fig. 5. (f, g) Normalized Enrichment Score from GSEA of H3K4me2 ChIP-seq at enhancers of conserved ASCL1 target genes or conserved NEUROD1 target genes (f) or top 5 enriched Hallmarks (g) from the ChIP-seq data in Fig. 5. For d-g, p-values were generated by GSEA using a permutation test adjusted for multiple hypothesis testing using the Benjamini-Hochberg correction. Adjusted p-values are indicated.

