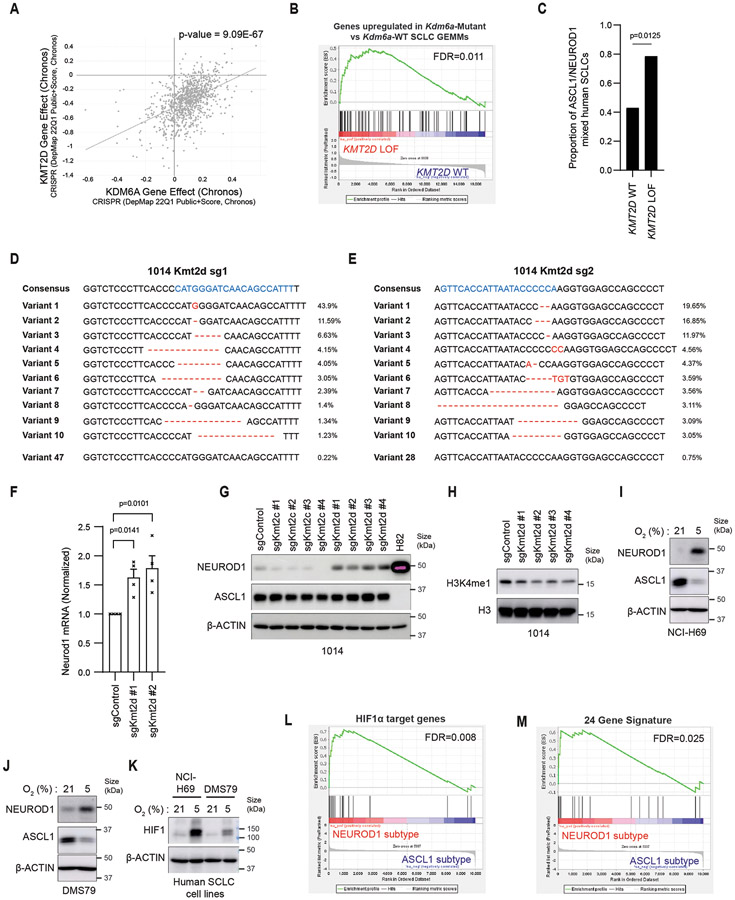
Extended Data Fig. 10. Analyses of KMT2D Loss or Hypoxia with NEUROD1 Expression in SCLC.
(a) Correlation of KDM6A dependency vs. KMT2D depedency across hundreds of cancer cell lines25. KMT2D is the #1 co-dependency with KDM6A (p-value=9.09x10−67 calculated using dependency map25). (b) GSEA using publicly available datasets of human SCLCs with KMT2D LOF mutations or KMT2D WT4 using genes upregulated in Kdm6a-Mutant vs. Kdm6a-WT SCLC GEMMs (see Fig. 1d). FDR q-value generated using GSEA, adjusted for multiple-hypothesis testing, is indicated. (c) Proportion of mixed ASCL1 and NEUROD1 human SCLCs from RNA-seq data from 3 independent data sets4,41,84 (see methods) in SCLCs with KMT2D LOF mutations vs. KMT2D WT. Fisher’s exact test was used to generate p-value. For b,c, n=14 KMT2D LOF, n=142 KMT2D WT. See also Supplementary Table 9. (d, e) CRISPR amplicon sequencing of 1014 Kdm6a-WT cells transduced with 2 independent Kmt2d sgRNAs. sgRNA sequences are in blue and gene editing is in red. (f) RT-qPCR for Neurod1 in 1014 Kmt2d knockout cells in d,e 3 weeks after transduction. Data are relative to Actb and then normalized to Neurod1 expression in the sgControl (non-targeting) cell line. n=4 biological replicates and error bars represent mean ± SEM. Statistical significance was calculated using unpaired, two-tailed students t-test and p-values are indicated. (g,h) Immunoblot (g) and histone blot (h) analyses in 1014 cells transduced with 4 independent Kmt2c and Kmt2d sgRNAs or a non-targeting control (sgControl) 30 days post-transduction. (i,j) Immunoblot analysis of NEUROD1 and ASCL1 expression of (i) NCI-H69 and (j) DMS79 ASCL1-positive human SCLC cells cultured under 5% or 21% O2 for 7 days. (k) Immunoblot analysis for HIF1α protein of cells lines in i,j. (l, m) GSEA analysis of scRNA-seq from human ASCL1 or NEUROD1 SCLC tumors34 using (l) HIF1α target gene list51 or (m) 24 genes induced by hypoxia50 (see methods) (see Supplemental Table 10). FDR q-value adjusted for multiple hypothesis testing is indicated. Model-based Analysis of Single Cell Transcriptomics (MAST) was used to generate the GSEA expression profile.

