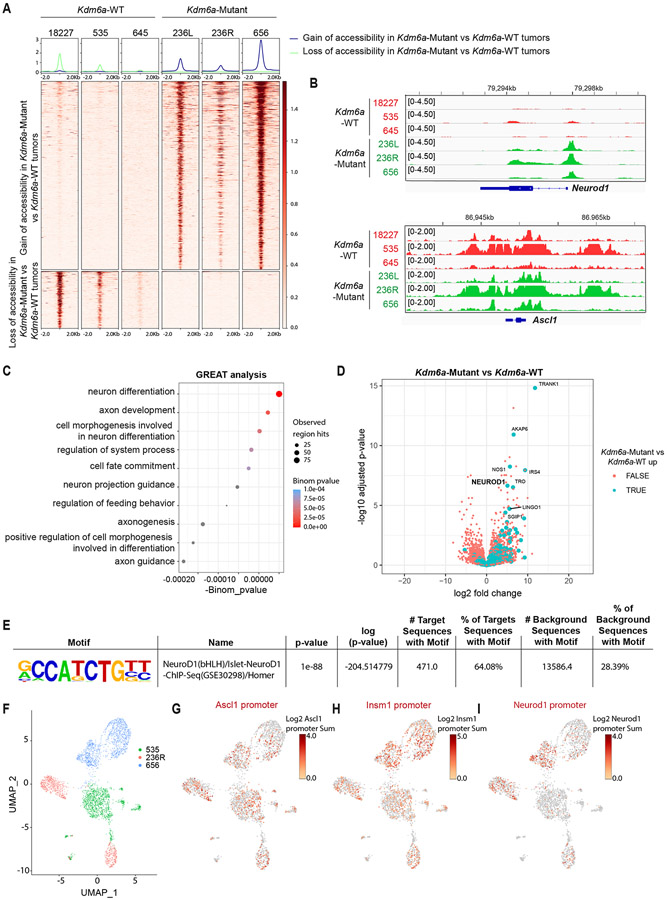
Fig. 2. KDM6A Inactivation Increases Chromatin Accessibility at the Neurod1 Promoter in Autochthonous SCLC Mouse Tumors.
(a) Heat maps of ATAC-seq read densities of upregulated (n=735) and downregulated (n=222) peaks near promoters in Kdm6a-Mutant (236L, 236R, 656) vs. Kdm6a-WT (18227, 535, 645) mouse SCLC lung tumors. (b) Tracks of ATAC-seq data at Neurod1 (top) and Ascl1 (bottom) promoters from the Kdm6a-WT (red) and Kdm6a-Mutant (green) mouse SCLC tumors indicated. (c) Genomic Regions Enrichment of Annotations Tool (GREAT) analysis of ATAC-seq data (from a) of the changes in Kdm6a-Mutant tumors vs. Kdm6a-WT tumors. Binomial p-values were calculated using GREAT. (d) Volcano plot of differential expression analysis from RNA-seq data from Fig. 1 comparing Kdm6a-Mutant tumors vs. Kdm6a-WT tumors. TRUE/FALSE analysis indicates if ATAC-seq differential peaks have matched nearby gene. p-values are calculated using Wald test in DEseq2 and were adjusted for multiple hypothesis testing. (e) HOMER Motif Enrichment analysis from ATAC-seq data from a showing that the Neurod1 motif is the top enriched regulatory motif in Kdm6a-Mutant tumors vs. Kdm6a-WT tumors (see Supplementary Table 3, tab 4 for complete HOMER Motif enrichment list). p-values are calculated using binomial test in HOMER2. (f) Uniform Manifold Approximation and Projection (UMAP) of single-cell ATAC-seq data of all cells from three independent tumors from 3 independent mice. n=1252 cells from Kdm6a-WT tumor in green (535), n=830 cells and n=1258 cells from 2 Kdm6a-Mutant tumors from independent mice in red (236R) and blue (656). (g-i) Chromatin accessibility at Ascl1 promoter (g), Insm1 promoter (h) and Neurod1 promoter (i) from single-cell ATAC-seq data from f.

