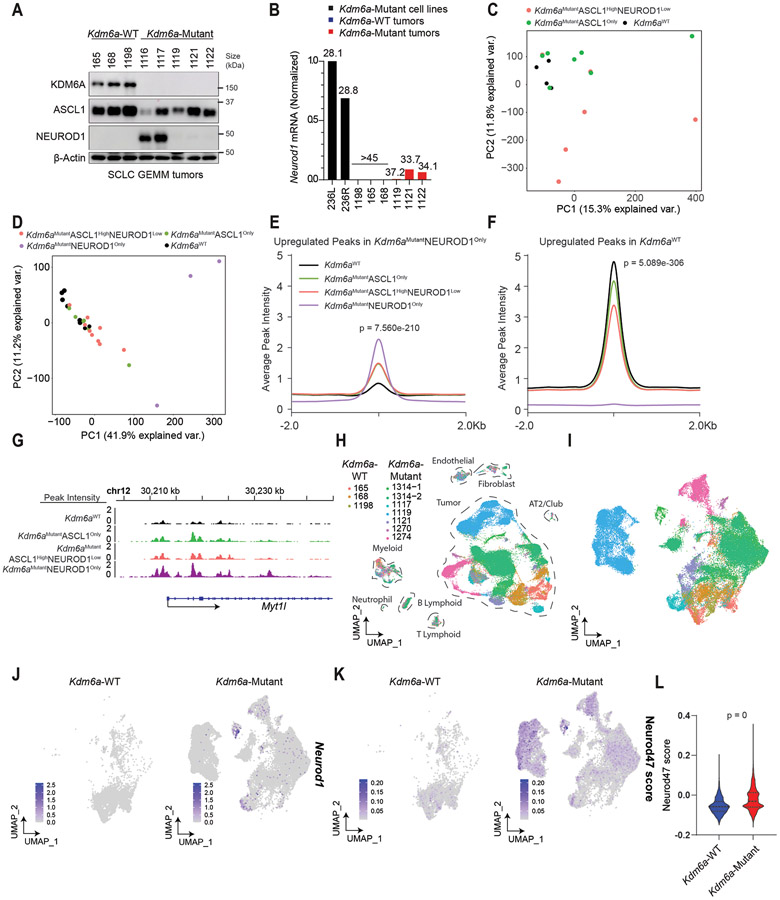
Fig. 3. Kdm6a Inactivation Alters Chromatin Accessibility and mRNA Expression for ASCL1 to NEUROD1 Subtype Switching.
(a) Immunoblot analysis of an additional cohort of SCLC lung tumors from LSL-Cas9 mice IT injected with sgControl RPP or sgKdm6a RPP adenoviruses. (b) RT-qPCR for Neurod1 from tumors from a where NEUROD1 protein was undetectable. Ct values of each sample are indicated on top. (c) PCA of all chromatin accessibility peaks from ATAC-seq data of 4 Kdm6aWT SCLC tumors, 7 Kdm6aMutantASCL1Only SCLC tumors, and 6 Kdm6aMutantASCL1HighNEUROD1Low SCLC tumors from the 2nd cohort of mice. (d) PCA of differential chromatin accessibility peaks in Kdm6aMutantNEUROD1Only vs. Kdm6aWT SCLC tumors (see Extended Data Fig. 3d) from both bulk and pseudo-bulk sc-ATAC-seq data of all tumors: 7 Kdm6aWT SCLC tumors, 7 Kdm6aMutantASCL1Only SCLC tumors, 7 Kdm6aMutantASCL1HighNEUROD1Low SCLC tumors, and 2 Kdm6aMutantNEUROD1Only SCLC tumors. For tumors in c,d, see Supplementary Table 4. (e, f) Average peak intensity at all peaks upregulated in Kdm6aMutantNEUROD1Only vs. Kdm6aWT (e) or upregulated in Kdm6aWT vs. Kdm6aMutantNEUROD1Only (f) for all tumors in d classified by phenotype. Legend in e also applies to f. p-values for e,f indicates comparisons among the 4 groups. p-values are calculated using Anderson-Darling k-sample test in R package “kSamples”. (g) Average chromatin accessibility tracks for each phenotype at the NEUROD1 target gene Myt1l from ATAC-seq data from d. (h) UMAP of all cells from scRNA-seq of the 10 autochthonous SCLC lung tumors indicated [3 Kdm6a-WT, 7 Kdm6a-Mutant including 5 Kdm6aMutantASCL1Only and 2 Kdm6aMutantASCL1HighNEUROD1Low). n=48,651 total cells. Cell types were determined based on representative marker expression (Extended Data Fig. 4a). (I) UMAP of all tumor cells from the scRNA-seq from h. (j,k) Feature plots of Neurod1 (j) or the Neurod47_score (k). (l) Neurod47_score violin plot from k. For l, non-parametric Wilcoxon rank sum test was used to generate a two-tailed p-value. n=35,446 Kdm6a-Mutant and n=6612 Kdm6a-WT tumor cells. Minimum and maximum values define the range of violin plot. Dotted lines represent median and upper and lower quartiles.

