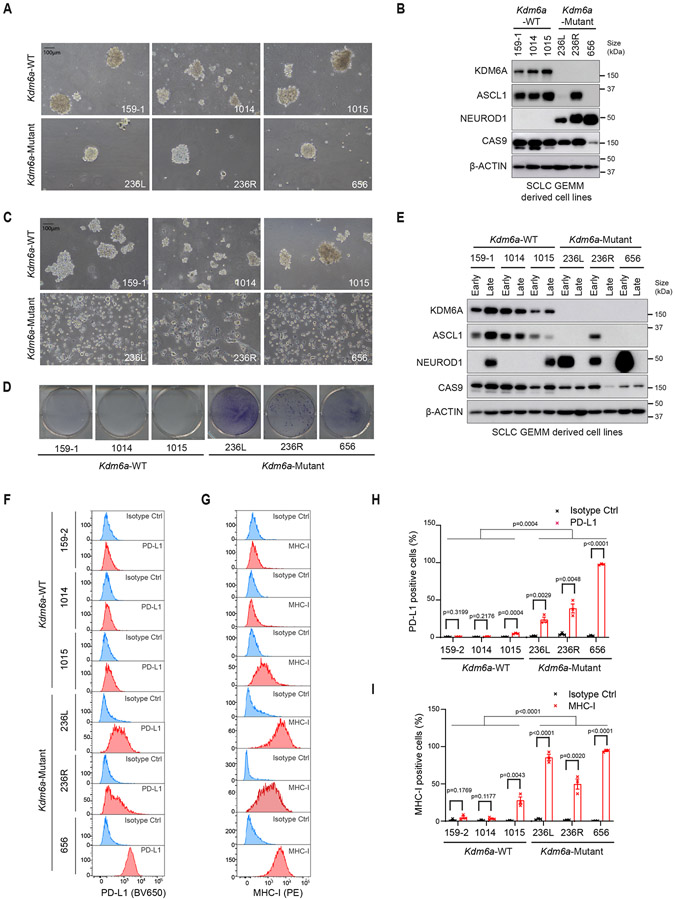
Fig. 4. KDM6A Inactivation Accelerates Plasticity Between SCLC Subtypes.
(a) Representative brightfield images and (b) immunoblot analysis of cell lines derived from Kdm6a-WT or Kdm6a-Mutant SCLC mouse lung tumors cultured in ultra-low attachment flasks at early times (<1 month) after the cell lines were generated (see Methods). (c) Representative brightfield images from cells in a and b after being maintained in ultra-low attachment flasks for 2 months in culture (late passage). (d) Crystal violet staining of late passage Kdm6a-WT or Kdm6a-Mutant cell lines plated on tissue culture treated 6-well plates for 48 hours. (e) Immunoblot analysis of cell lines shown in a and c comparing ASCL1 and NEUROD1 protein levels in early vs. late passage tumor-derived cell lines (see Methods). (f-i) Histograms (f,g) and quantification (h,i) of flow cytometry analysis for cell surface expression of PD-L1 (BV650) (f, h) and MHC class I (H2-Db) (PE) (g, i) in the late passage Kdm6a-WT and Kdm6a-Mutant cell lines. For f-i, n=3 biological independent experiments. Data are presented as mean values ± SEM. Statistical significance was calculated using unpaired, two-tailed students t-test and p-values are indicated on each figure panel. For all t-tests in h,i comparing all Kdm6a-Mutant vs. Kdm6a-WT cell lines, t-test compares all late passage Kdm6a-Mutant vs. all late passage Kdm6a-WT. Scale Bar=100 μm.

