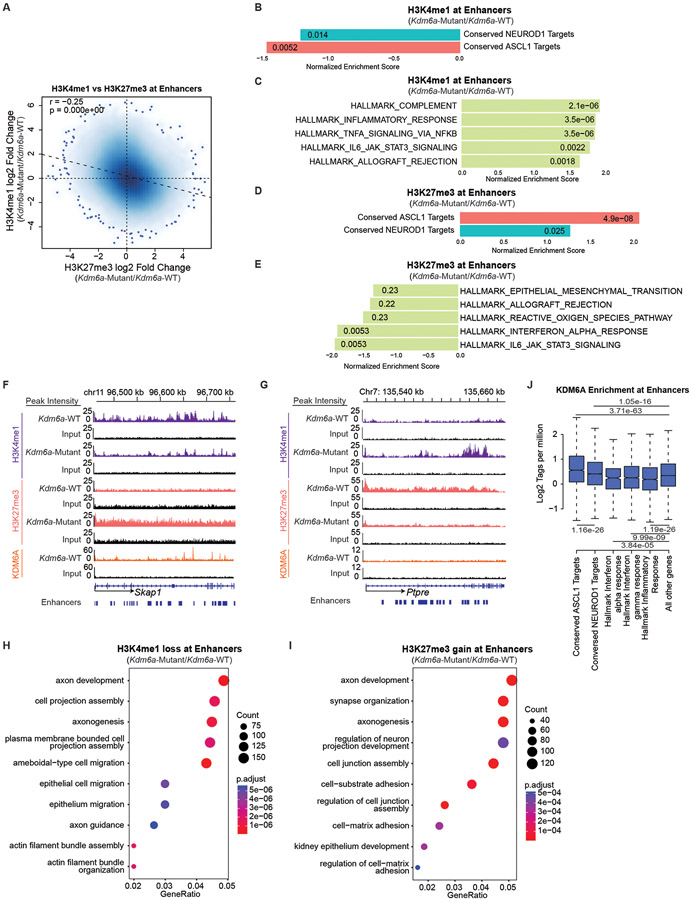
Fig. 5. KDM6A Binds and Regulates Neuroendocrine Genes to Maintain a Chromatin State Permissive for the ASCL1 Subtype.
(a) Genome-wide correlation of log fold change in H3K4me1 ChIP-seq (Kdm6a-Mutant/Kdm6a-WT) vs. log fold change in H3K27me3 ChIP-seq (Kdm6a-Mutant/Kdm6a-WT) at enhancers. See Supplementary Figs. 2&3. For a, r=Pearson correlation coefficient. p-value was calculated using a two-sided Pearson’s correlation test. (b, c) Normalized Enrichment Score from GSEA of H3K4me1 ChIP-seq at enhancers of conserved ASCL1 target genes or conserved NEUROD1 target genes (b) or top 5 enriched Hallmarks (c) from the ChIP-seq data in a. (d, e) Normalized Enrichment Score from GSEA of H3K27me3 ChIP-seq at enhancers of conserved ASCL1 or NEUROD1 target genes (d) or top 5 depleted Hallmarks (e) from the ChIP-seq data in a. (f, g) Tracks of H3K4me1, H3K27me3, and KDM6A ChIP-seq at the ASCL1 target gene Skap1 (f) or an inflammatory gene Ptpre (g) showing changes representative of the analyses in b-e. Each track is the peak sum of: 2 Kdm6a-WT tumor-derived cell lines for Kdm6a-WT (159-1,1014) and 2 Kdm6a-Mutant tumor-derived cell lines for Kdm6a-Mutant (236L,236R) with their respective input. (h,i) Gene ontology (GO) analysis of enhancers that lose H3K4me1 (h) or gain H3K27me3 (i) in Kdm6a-Mutant/Kdm6a-WT. For h,i, p-values were generated by GSEA using a permutation test adjusted for multiple hypothesis testing using the Benjamini-Hochberg correction. Adjusted p-values are indicated. (j) Boxplot of genome-wide KDM6A ChIP-seq enrichment at enhancers of ASCL1 conserved targets, NEUROD1 conserved targets, and inflammatory genes vs. all other genes. For j, indicated p-values are calculated using unpaired, two-sided, Mann-Whitney U tests adjusted for multiple hypothesis testing. n=2,958 enhancers (ASCL1), n=9,217 enhancers (NEUROD1), n=567 enhancers (Interferon α), n=2,220 enhancers (Interferon γ), n=2,442 enhancers (Inflammatory), n=191,064 enhancers (Other) from 2 biological independent replicates. The center line is the median, the lower and upper bounds represent 25% and 75% rank and the whiskers indicate 1.5 times the interquartile range. For all experiments, H3K4me1 and H3K27me3 ChIP-seq is from 2 independent Kdm6a-Mutant cell lines (236L,236R) and 2 independent Kdm6a-WT cell lines (1014,159-1). KDM6A ChIP-seq is from 2 independent Kdm6a-WT cell lines (1014,159-1). Also see Supplementary Table 7.

