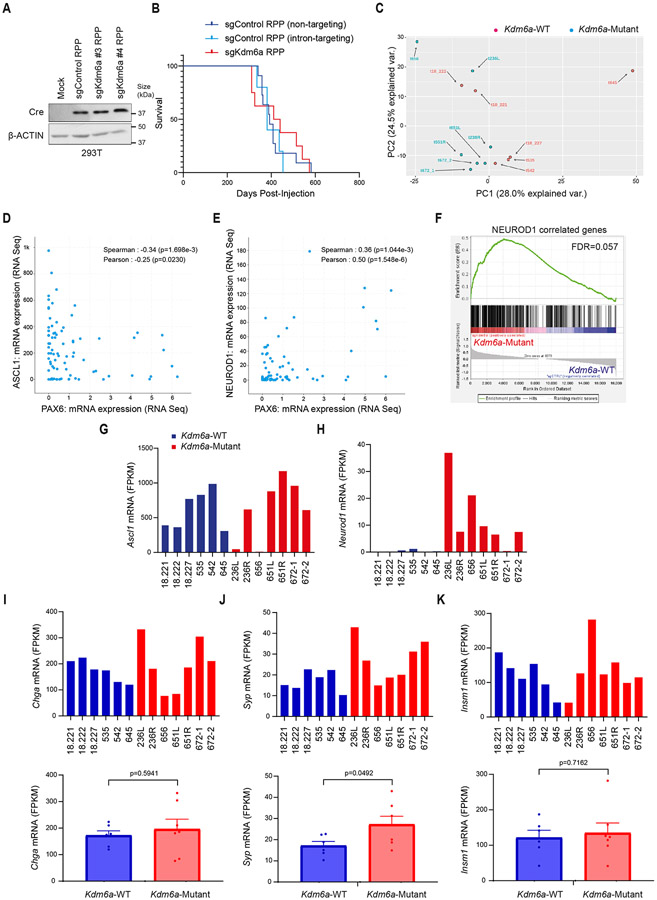
Extended Data Fig. 1. KDM6A Inactivation in an Autochthonous SCLC Mouse Model Promotes NEUROD1 Expression Leading to SCLC Tumors that Express both ASCL1 and NEUROD1.
(a) Immunoblot analysis of 293T cells infected with adenoviruses that encoded Cre recombinase and the indicated sgRNAs. (b) Kaplan-Meier survival analysis of LSL-Cas9 mice IT injected with the indicated adenoviruses. p=0.3447 for sgKdm6a RPP vs. sgControl RPP (non-targeting), p=0.2781 for sgKdm6a RPP vs. sgControl RPP (intron-targeting), p=0.3481 for sgControl RPP (non-targeting) vs. sgControl RPP (intron-targeting). n=11 mice sgControl RPP (non-targeting), n=5 mice sgControl RPP (intron-targeting), and n=8 mice (sgKdm6a#4 RPP). (c) Principal component analysis (PCA) of gene expression from RNA-seq data of 6 Kdm6a-WT SCLC mice tumors (18,221, 18,222, 18,227, 535, 542, 645) and 7 Kdm6a-Mutant SCLC mice tumors (236L, 236R, 656, 651L, 651R, 672-1, 672-2) in Fig. 1d. (d, e) mRNA expression of ASCL1 vs. PAX6 (D) or NEUROD1 vs. PAX6 (e) from publicly available RNA-seq data set of 81 human SCLC samples from George et al. Nature 20154. p-values are generated from cbioportal.org. (f) Gene set enrichment analysis (GSEA) of RNA-seq data (from Fig. 1d, Extended Data Fig. 1c) of NEUROD1 correlated genes (401 genes; see Borromeo et al. Cell Reports 201629, see Supplemental Table 2)29. FDR q-value calculated using GSEA is indicated. (g-k) mRNA expression from the RNA-seq data (from Fig. 1d) for Ascl1 (g), Neurod1 (h), Chromogranin A (i), Synaptophysin (j) and Insm1 (k) of individual Kdm6a-WT and Kdm6a-Mutant mouse SCLC tumors. For i, j, and k, lower graphs show average mRNA expression in Kdm6a-WT vs. Kdm6a-Mutant lung tumors (see Supplementary Table 2). For i,j,k, data are presented as mean values ± SEM. Statistical significance was calculated using unpaired, two-tailed students t-test and p-values are indicated on each figure panel. n=6 Kdm6a-WT tumors from independent mice and n=7 Kdm6a-Mutant tumors.

