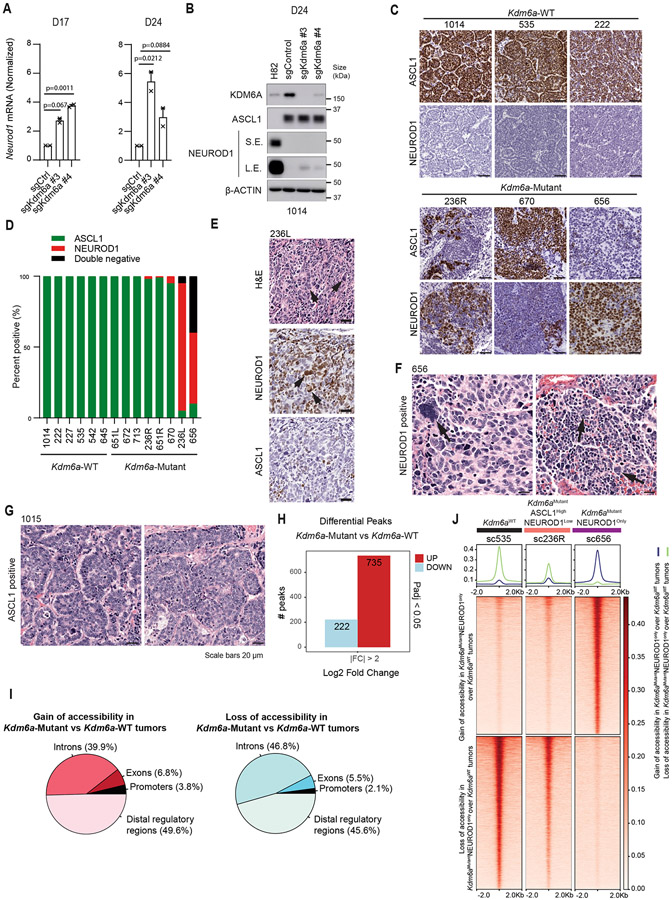
Extended Data Fig. 2. IHC and ATAC-seq Data from Kdm6a-Mutant vs. Kdm6a-WT Autochthonous SCLC tumors from Figs. 1&2.
(a) RT-qPCR for Neurod1 at the times indicated after transduction of mouse SCLC cell lines derived from Kdm6a-WT mice (1014) with 2 independent Kdm6a sgRNAs or a non-targeting sgRNA (sgControl). Data are relative to Actb and then normalized to Neurod1 expression in sgControl sample. n=2 biological independent experiments. Data are presented as mean values ± SEM. Statistical significance was calculated using unpaired, two-tailed students t-test and p-values are indicated. (b) Immunoblot analysis of the cells from a 24 days after transduction. NCI-H82 cells, a human NEUROD1-high SCLC cell line, is used a positive control for NEUROD1 expression. (c) Immunohistochemistry (IHC) for ASCL1 and NEUROD1 from 3 Kdm6a-WT and 3 Kdm6a-Mutant mouse SCLC lung tumors. Scale Bar=50 μm. (d) Quantification of ASCL1-positive, NEUROD1-positive and ASCL1/NEUROD1-negative (double-negative) cells in Kdm6a-WT tumors (n=6 tumors) and Kdm6a-Mutant tumors (n=7 tumors) from the multiplex-IF data in Fig. 1j. (e) Representative H&E and IHC staining for NEUROD1 and ASCL1 of a Kdm6a-Mutant tumor (236L). (f,g) Representative H&E of a Kdm6a-Mutant tumor (656) (f) and a Kdm6a-WT tumor (1015) (g). For e and f, black arrows show enlarged nuclei of NEUROD1-positive cells with occasional multi-nucleated giant cells. Scale Bar=20 μm. (h) Bar graph of upregulated (red) and downregulated (blue) differential accessible peaks with LFC>2, pAdj<0.05 from ATAC-seq data in Fig. 2a in Kdm6a-Mutant vs Kdm6a-WT tumors. p-values are calculated using Wald test in DEseq2 and adjusted for multiple hypothesis testing. (i) Pie charts of genomic location of differential accessible peaks from a. (j) Heat maps of ATAC-seq read densities from pseudo-bulk analysis of scATAC-seq data from Fig. 2f showing gain (n=11,760 peaks) or loss (n=10,587) of accessibility of Kdm6aMutantNEUROD1Only vs Kdm6aWT SCLC tumors (see Extended Data Fig. 3d).

